
To master the skills in any domain you need to start from the beginner level while being attentive to every small detail that has something to do with acquiring the required skill set. But, with Tableau, things are different as it is so easy to use that anyone can operate it without having in-depth knowledge of coding. Understanding and visualizing data in Tableau is pretty simpler than any other Business Intelligence software in the market.
So, if you are already using Tableau as your BI software and want to see your dashboards run even faster, just a little attention to few specific details would suffice your requirement. Here are 5 quick tips to amplify your dashboard skills and speed up the overall workflow taking development to the next level.
Let’s begin…
in your business with
Gartner Rated Tableau
Pro Tip #1: Check the File Connectivity
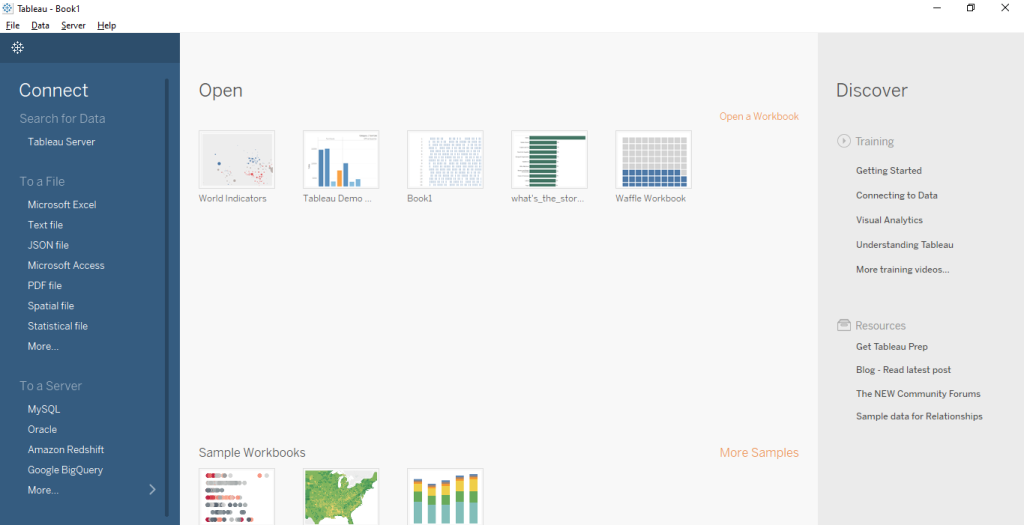
Talking about Tableau native file connectors we might have encountered errors like ‘Illegal File type’ or ‘File Type not supported’. While connecting to the .csv extension file if we might happen to click excel file connector or likely we may not recall file extension on that grounds then this is what the error appears to be? If that’s a ‘Yes’, you are at the right place to look at.
So, as a speed Tip#1, follow this best practice to click ‘More’ in the File connector so that in case you forget the file extension type or other concern, the error will be bypassed, VOILA!
Pro Tip #2: Simply Drag & Drop Data File in Tableau
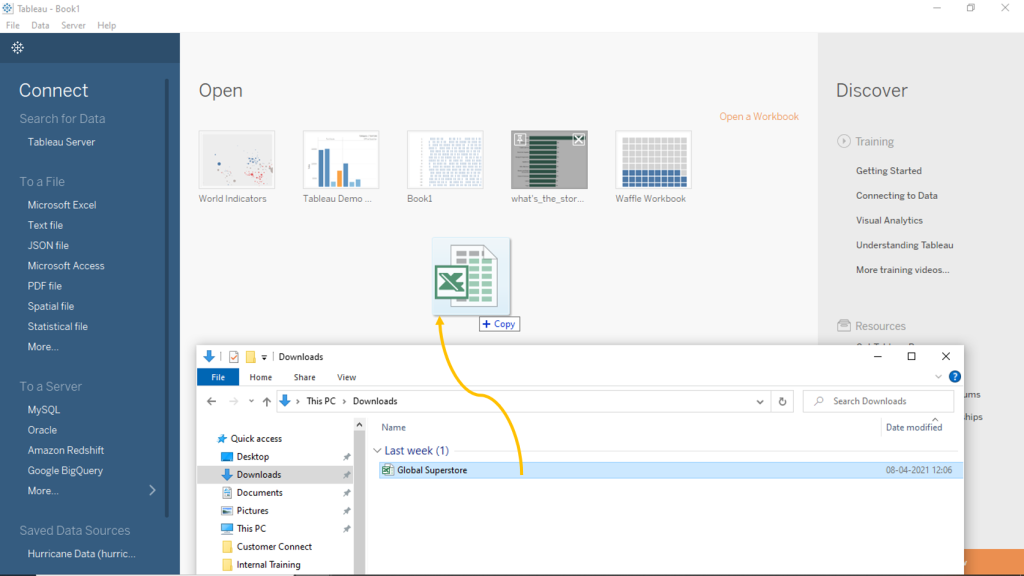
More from Tip #1: Connect your file data using just the Drag and Drop way in Tableau. In general, to connect a data file we usually select the file connector and next select our desired file location to get started. As a speed Tip #2: On your Tableau Desktop screen data, you can now connect screen directly; simply drag and drop the desired data file to work within Tableau and we are good to go, saves time, YES!
Pro Tip #3: Color Codes All-Time High
(or, Use of Vibrant Color Codes)
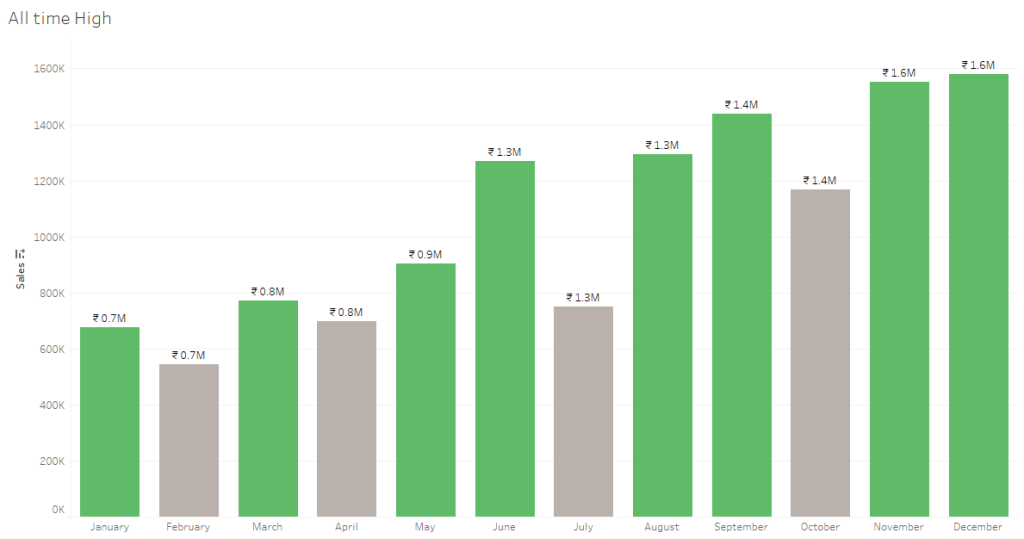
Let’s take an example; at times we encounter a use case to visualize if standing months’ sales are greater than the previous month. To add more visual interactivity a quick calculation to color bars to show an all-time high is a quick tip. As a speed Tip #3: Create a calculation field and drop it on the Color Marks pane and it’s sorted:
The green bars show up an all-time high compared to previous month while the grey bars show low sales value compared to the previous.
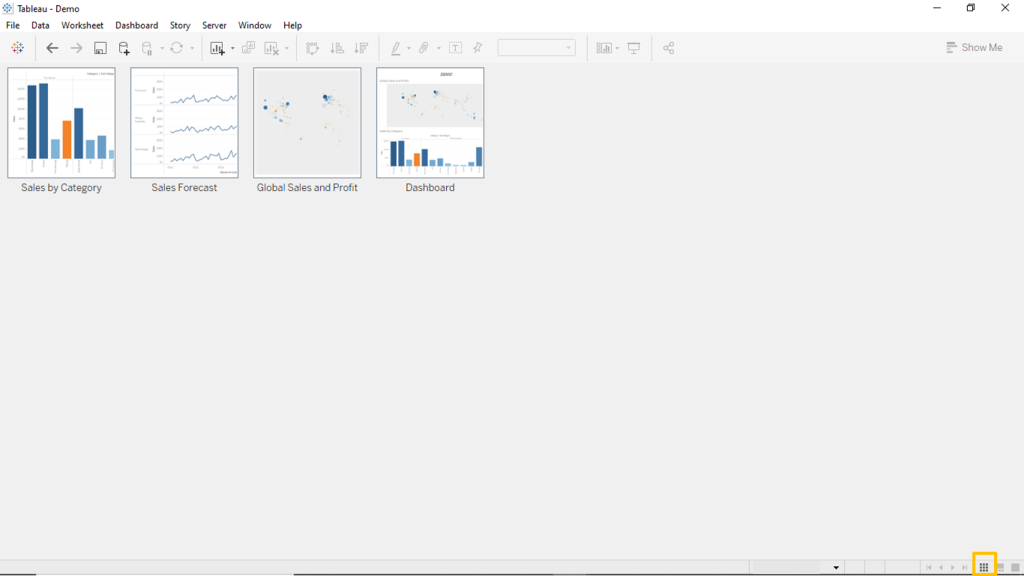
Pro Tip #4: Use Grid View
This remains to be one of the less talked about tips but serves to be pivotal. Multiple sheet views when collated on a single sheet make a Tableau dashboard. Often there are lots of worksheets and one may like to have a display of different sheets for their own reference purpose, like sorting these worksheets or viewing the same. As a speed Tip #4: Access the grid view icon on the Tableau desktop at the bottom right side; it displays all your worksheets on one screen. You could use these sheets to sort the order as well, VOILA.
Pro Tip #5: Leverage Handy dandy Shortcuts in Tableau
With fewer mouse clicks and more shortcuts, ‘Tableau keyboard shortcuts’ are a game, often less practiced and known. Using these shortcuts can amp up your dashboard development skills. The best practices for dashboard building are often coupled with time stipulated dashboard development. These shortcuts serve as handy for dashboard development and the sooner you put it to practice the more you get a grip of it, hang off the tool and yes none the less it’s what makes you more productive.
Top handy dandy shortcuts which are of regular use are:
| Keyboard Shortcut | Purpose |
|---|---|
| Ctrl + N | New Workbook |
| Ctrl + M | New Worksheet |
| Ctrl + H | Presentation Mode |
| Ctrl + D | Connect to Data |
| Ctrl + W | Swap rows/ column |
Closing Note
Tableau Business Intelligence software is already 10-100X faster than existing Business intelligence Solutions in the market. Also, its smart and creative dashboards render richer insights into business data to foster your decision-making and predictive analysis. Just follow these simple tips and amp up your BI game to a whole new level.