The microfinance sector has been instrumental in providing a huge impetus to the unorganized sector and transforming the lives of millions of beneficiaries. This industry has been making a huge contribution to the growth of the Indian economy but often confronted with its set of challenges like evaluating strategic and credit risks, inadequate investment validation, financial reporting, maintaining compliance, and so much more.
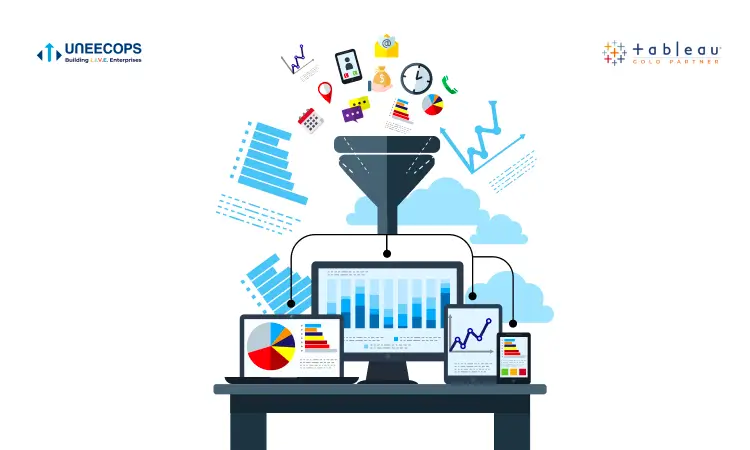
To realize growth opportunities in this sector, it is essential to mitigate ongoing concerns by making a route toward digitization. Tableau software empowers all Microfinance leaders to foster opportunities for microlenders, increase customer reach and analyze associated risks in the form of fraud, credit risk, security, asset and liability risks.
Let’s find out how Tableau empowers the Microfinance industry to manage it all.
- Loan Risk Analysis
Tableau dashboard helps microfinance industry to assess the risk of loan by selecting one or more portfolios to see credit score distribution and trends. It also examines the creditworthiness of an individual and explores credit score distribution as per the grade level. Tableau also helps banks to identify the potential risk of debt write-off by loan type, examine risk trends and helps them understand the customers’ journey better.
- Reserve Requirement Analysis
Organizations, large and small across banking, wealth management, and insurance, are leveraging Tableau dashboards to gain a clear view about reserve requirements in your industry. It helps you understand the trends of daily withdrawal amount, cash on hand etc. This helps the microfinance industry to meet liabilities in case of sudden withdrawals. This also ensures that the banks have money on hand to prevent them from running out of cash in the event of mass withdrawals.
- Collection Analysis
Tableau software provides key credit and collections metrics. It helps examine balance overdue, credit exposure, and customers that are over their credit limit. Within a matter of minutes, it displays transactional data and provides a comprehensive view of credit and collections across all branches. You can dive deep and know the metrics as per company, customer group, and customers.
- Mitigate compliance risks
Compliance is a key consideration in the microfinance industry and the magnitude of its impact is intensifying. It helps you perform compliance audits and attain more impactful internal audits. The BI software helps businesses reduce their risk exposure such as reconciling payroll spending data and the general ledger. It also helps spot waste by identifying duplicate payments and automate audit steps.
- Settled and unsettled claim analysis
Tableau gives a 360 view of claims that are settled and unsettled. It also evaluates region wise, state wise, region wise claims. The software helps you make a top-level analysis which helps to drill down details in one place. In essence, advanced BI helps you quickly manage claims and premiums with ease.
- Outstanding and overdue analysis
It helps to gain outstanding and overdue analysis. Tableau software renders great information on PAR loan and PAR amount (FY wise- Month a Month), Par bucket, Par by caste, religion, product and area. The software also helps to make top analysis by branch, product and purpose.
The power of data insight is undeniable, and with a robust platform that can provide a 360-degree view of all data—you are better able to build accurate risk profiles, identify fraud and irregular activity, mitigate compliance risk and make data-driven decisions.


