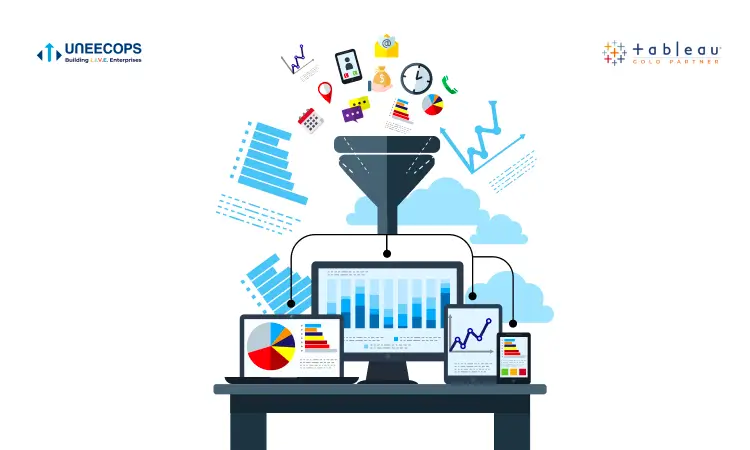
Tableau dashboards render a holistic view of your data and help you zero in on the information that is most valuable and often goes unrecognized. Dashboards empower you to pay attention to high potential zones, dim areas and highlight actions in interesting ways. Within a short period of time, you can deep dive into useful metrics.
Inbuilt dashboards allow every business user to discover new and fact-based insights without any technical complexity, unlike traditional models. The conventional method of viewing data from legacy software and spreadsheets have their limitations when faced with the volume and density of data. Dashboards capture the attention of every business user and help you identify from red, blue, yellow, and interesting patterns. Business intelligence dashboards can come in all different forms and the possibilities of how the data can be portrayed and the stories can be laid are endless.
Let us now dive deeper into the possibilities of Tableau dashboards and see how it helps retail, F&B, and other industries.
Retail Industry
Analyze the metrics related to sales, revenue and inventory movement in your retail industry. There’s no need to spend hours analyzing spreadsheets and reports. You can use Tableau dashboards to gain useful metrics such as-
Product Availability
Analyze the metrics related to product availability in your retail industry. There’s no need to spend hours analyzing spreadsheets and reports. You can use Tableau dashboards to gain useful metrics and gain a clear picture of correct inventory levels at all times, at their respective stores. With enterprise-ready BI software, it is easier to analyze product availability and drill down by category, day and store location conveniently. Further, retailers and wholesalers can identify gaps in product availability and take proactive and timely actions.
Promotional analysis
In today’s digital marketplace, understanding each phase- pre-promotion and post promotion is critical for retailers. The dashboards give critical information to retailers to know what’s happening in the promotional cycle and marketing campaigns. The promotional analysis helps retailers to change their promotional strategy or boost it further for added benefits.
Exploration of Shopper Behavior and Shopping Cart
Deeply understanding customer buying patterns is extremely critical in the retail industry to stay relevant and profitable. Tableau dashboard helps identify trends in shopper behavior, view reasons for abandoned shopping carts, improve conversion rates and avoid lost sales.
Market Basket Analysis
Cross-selling and upselling are essential to keep the momentum of profitability in the retail industry. With Tableau, you can analyze and know which products have a great match with one another. This helps you to know which customer segments buy the combination. With smart insights, you can increase profit margins by pairing discounted items with highly profitable products.
End-to-end supply chain analysis
Now it is possible to deliver the seamless shopping experience to your customers that they are seeking. For this, optimizing your entire supply chain is the recipe for success. The advanced BI insights help you gain high visibility into your entire supply chain operations. It helps you analyze the current inventory flows and in-store fulfillment.
Quickly see trends and year on year performance
Senior management can quickly anticipate trends, year on year performance and gain a comprehensive view of your business. The dashboard helps in detailed analysis and empowers all C-level members to use and drill down deeper and evaluate everything by product, store, state, city, high profit and less profit-wise.
Let’s find out how Tableau empowers the retail industry on various fronts.
| YOY Comparison(Sales) and Store-wise (Net Sales, Collection & Outstanding) analysis | Location Wise Customer Retention Percentile | Evaluation of Till Day Vs last Day, WTD Vs LWTD, MTD Vs LMTD (With Tax Without Tax) | Percentile of Sales from New Customer & Old customer & its distribution |
|---|---|---|---|
| ABC Analysis of Stores (Net Sales, Collection & Outstanding) | Comparative Analysis (YOY, MOM) of Business Growth, churn rate and additive rate | Day by Day comparison for any selective Month/Store/ Region/S | Store Wise Category, Sub category & Brand Bifurcation |
Food & Beverage
Fluctuating consumer demands, expanding health guidelines and a demand for greater transparency creates a need for real-time data analysis. Tableau dashboards help you drill down from high-level trends to granular insights. It helps businesses to gain better visibility into demand and operational performance, better product planning, expiry management, and perform deep market analysis such as-
Food safety audit analysis
The F & B industry today encounters many audit scenarios that comprise customer, regulatory, supplier and internal audits. The dashboard gives you a clear view of the audit process required in this industry and enables companies to meet international quality standards.
Stock analysis
Tableau helps F & B leaders to track byproducts, co-products, yield, wastage and expiry dates. The dashboard also keeps a track of warehouse movements that happen forward, backward, and on-demand.
Food preferences analysis
Tableau helps businesses track customer interactions and order history to analyze their food preferences. Maintaining a list of customers with their buying preferences enables companies to better serve their customers.
Supply chain analysis
It is easier to know and track lot numbers and sell-by dates, as well as generate reports of each customer transaction, manage expiry dates, and create a record of these transactions with Tableau.
Analysis of production and packing
Overcome constant pressure of ever-changing and seasonal demands of customers by keeping a close tab on demand and supply. The software empowers all business users to analyze key requirements of production and packaging in a timely manner.
Analysis of performing and underperforming products
Often store managers struggle with legacy software and hundreds of columns and rows of data making it difficult to lay business decisions. Tableau empowers all F & B managers to identify and reveal key insights faster about performing and underperforming products.
Let’s find out how Tableau empowers the F & B industry on various fronts.
| Net Sales, Net Tickets | Net ADS, ADT | Brand Wise Sales | Sub-Brand Wise Sales |
|---|---|---|---|
| Net Transactions | Net APC | No. of Stores (Core, Non-Core, New) Meal Time & Day Wise Contribution on the basis of Sales,Transactions, APC,ADS, AD) | Top and bottom analysis of stores |
Education Industry
Leading school districts and administrators often look for information that can render useful business information just by a glance. Tableau empowers all leading educators, leaders, stakeholders, and influencers to take action for change such as-
Analyzing space usage
Understanding how your school, colleges and universities are using physical space is a critical part of functioning effectively, from planning classes to maintaining emergency plans. Tableau helps education institutions to analyze the space used on their campus. This is imperative to plan budgets and allocate resources to the places that need it most. Anyone using dashboard can see the area used by each department, plan for future growth and understand areas of current space usage.
School- Level performance assessment analysis
The management and stakeholders in each school have a lot to manage with regard to its educators, administrators and student performance outcomes. A school level-assessment dashboard will give key insights that help them to do an assessment at the school level, quickly identify low performing students and even drop-out. All of this data together can bring forth early indicators so that management can take action for improvement.
Infrastructure and Facilities Analysis
The path to student success has hidden obstacles which could be an uncomfortable environment, legacy furniture, old lab instruments and so much more. Tableau empowers decision-makers to re-examine and prioritize technological needs each year. For instance, viewing it from laptops and tablets to projectors and facilitating students with advanced assets.
Staff analysis
Stay organized and informed with all your staff data at your fingertips. Easily access the data and avoid hopping on multiple excel sheets and spreadsheets saving a substantial amount of time. Tableau helps you move from legacy shell and numbers to actual data and decisions about your staff.
Identify and monitor underperforming students
Tableau dashboard helps educators track student performance. It highlights the area of missing and late assignments, making it easy to identify underperforming and high performing students. Teachers can also drill down to each student’s reports and gain a key understanding of their individual performance.
Let’s find out how Tableau empowers the education industry on various fronts.
| Location wise grade-wise performance | Student & related subject wise present and absent trend (MOM basis) | Attendance analysis | Chapter-wise attendance analysis |
|---|---|---|---|
| Overall LSRW & Taxonomy | Govt. Vs Private (LSRW & Taxonomy) | Summary Information (Student Coverage- Govt. / Private & Grade wise) | Actual & Planned teaching days, Present & Absent ratios) |
Conclusion
Jumpstart your analysis and kickstart your data-driven journey in your business with these insightful dashboards. Get useful business metrics on the go and glean critical insights with robust and powerful BI software. Tableau software delivers the right information to the right people, as soon as they want it.
Uneecops is a Bronze partner of Tableau that will help you take a walk through Tableau and its dashboards. Clients like Haier, Fab Hotels, World Health Organization, Apollo Munich, Metalman Auto Pvt. Ltd. are a few of our eminent clients using Tableau software.