The word dashboard rings many bells – you may first think of your car dashboard or the business analytics dashboard you work on. But did you know, dashboards have come a long way. They’ve evolved through three distinct generations, each reflecting society’s technological advancements and changing needs. Just as horses once led carriages down muddy pathways, modern business intelligence dashboards now guide organizations down the information superhighway, providing valuable insights to help them make informed decisions.
And while Uneecops is all about analytics automation and offering cutting-edge data analytics dashboard services, we thought it would be interesting to take you on a journey through the three generations of dashboards and show you how analytics automation, a service we excel at, transforms how businesses harness data’s power.
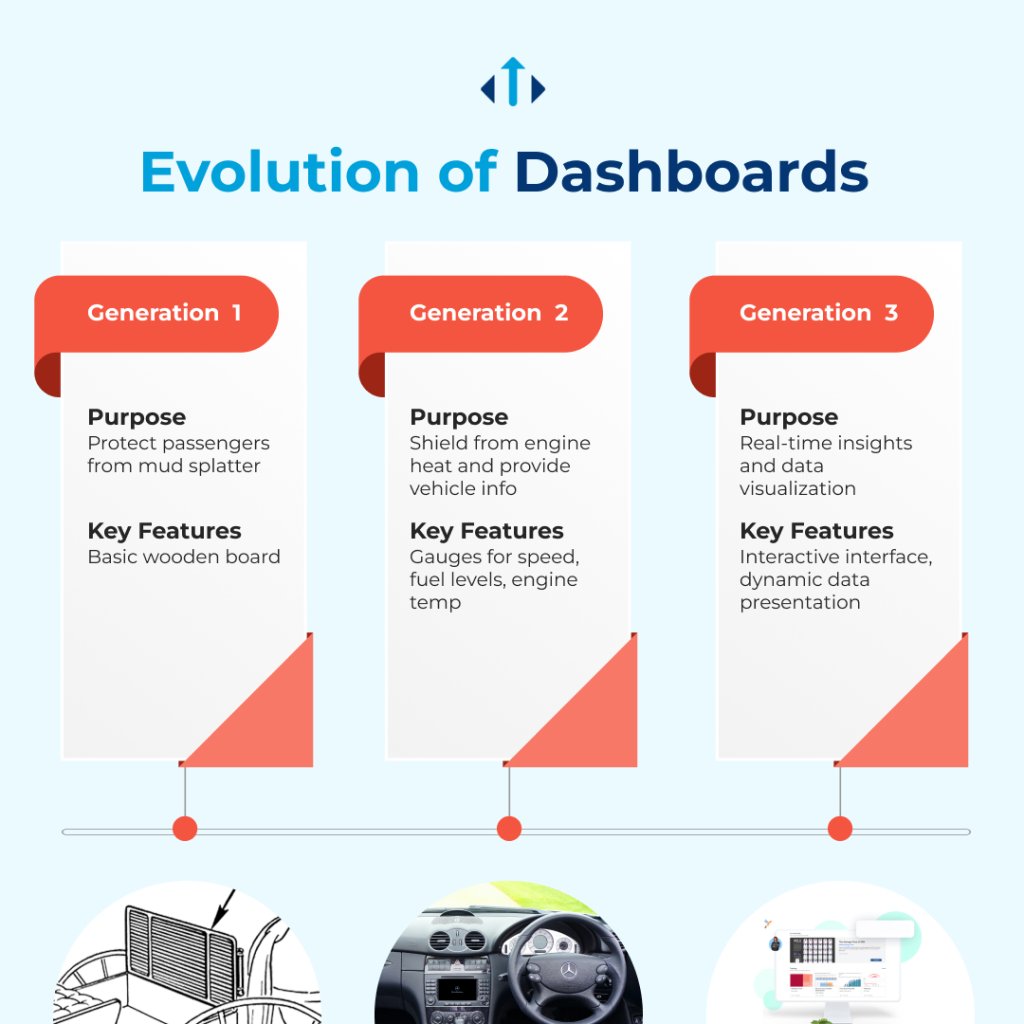
Generation 1: The Horse-drawn Dashboard
Picture this: a horse-drawn carriage plowing through dirt roads, kicking up mud in its wake. Those inside the carriage were not spared from the mess. To address this issue, a simple wooden board was rigged up behind the horse to catch the mud splatter. This rudimentary contraption was the precursor to what we now call a “dashboard.”
In this first generation, the dashboard’s primary function was purely practical – to shield passengers from the inconvenience of flying debris. However, this basic concept laid the foundation for what would later become a crucial element in data visualization. It’s all about evolution, isn’t it?
Generation 2: The Automotive Dashboard
With the advent of the internal combustion engine, cars became the new mode of transportation. These engines generated a significant amount of heat, which required additional protection for the occupants. The dashboard was reintroduced, this time as a shield against the intense heat emanating from the engine.
As cars evolved, so did the dashboard’s purpose. Gauges were added to provide essential information, such as speed, fuel levels, and engine temperature. The back of the dashboard became a natural location for these indicators, giving drivers and passengers crucial insights into the vehicle’s performance. Drawing from ‘performance’, the ideation of the new-gen business intelligence dashboards came up.
Generation 3: The GUI/ Analytics Dashboard
Fast forward to the digital age, where computers took center stage. Graphical User Interfaces (GUIs) revolutionized the way we interacted with technology. The metaphor of the dashboard was reimagined in this era. Instead of merely monitoring fuel burn, today’s analytics dashboard allows us to look ahead, providing a heads-up display of critical information.
In business intelligence, dashboards have become indispensable tools for decision-makers. With automated analytics, they offer real-time insights into various aspects of an organization’s performance, from sales trends to operational efficiency. The metaphorical “dashboard” has transformed into a dynamic, interactive automation analysis interface capable of presenting vast amounts of data in visually appealing and understandable ways.
It has been an interesting journey from a mere shield to today’s business automation analysis tool. For dashboards today, it is all about data analytics process automation. Uneecops takes it from here to shape the future of data-driven decision-making.
Why We Promote Automated Analytics and Show Modern Businesses the Intricacies of Data Analytics Dashboard Creation?
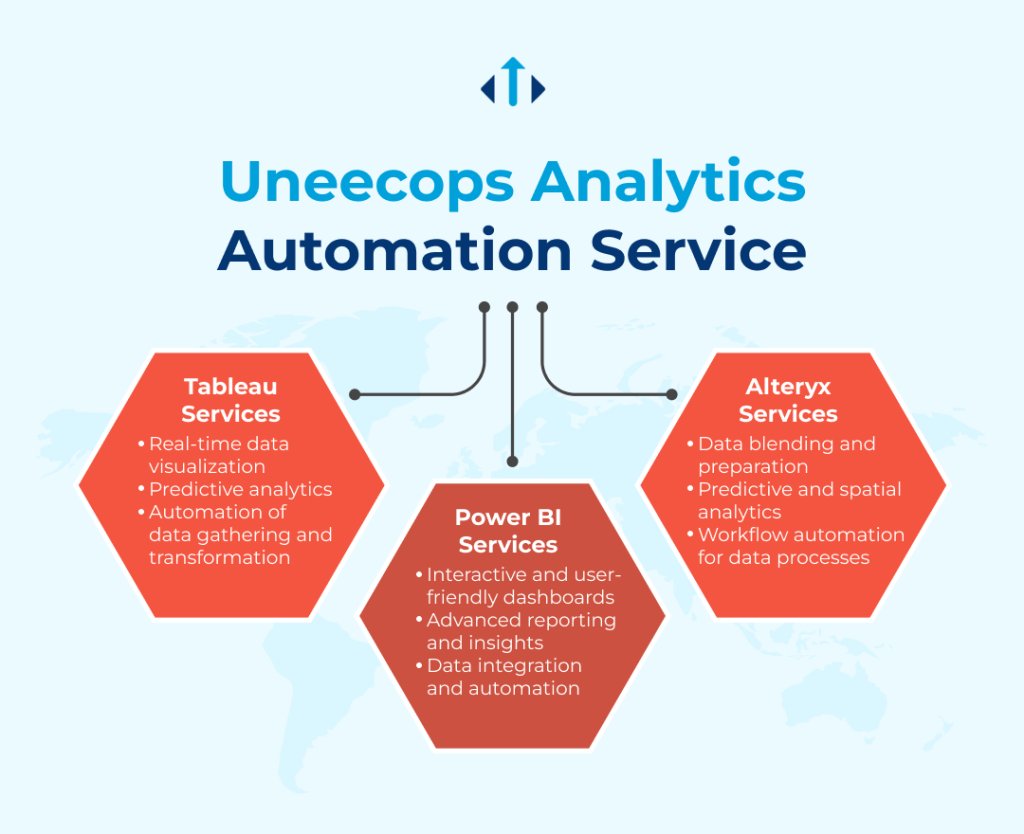
In today’s data-rich environment, organizations are drowning in information. The key challenge is collecting data and extracting actionable insights from it. That’s where automation analysis tools come in. Modern data analytics process automation systems like Tableau, Power BI and Alteryx help businesses in interpreting, visualizing and extracting insights from data. These tools are a boon in the era of massive competition. Enterprises, big or large, embracing analytics automation are able to win the ‘competitive edge’ war. But again, no war is won single handedly.
Uneecops, with specialized automation data analytics experts, makes it faster, more efficient, and more accurate to create business intelligence dashboards.
Our services in Tableau, Power BI, and Alteryx enable businesses to create advanced, automated analytics dashboards that provide real-time insights and predictive analytics. For example, imagine a sales dashboard that displays historical sales data and predicts future trends, helping your sales team make proactive decisions.
Moreover, our automation data analytics solutions reduce the manual effort required to gather, clean, and transform data, allowing your team to focus on what truly matters – interpreting the insights and driving strategic initiatives. Let’s take a closer look at our dashboard services for each automation data analytics tool.
Tableau Analytics Dashboard Solutions
Leveraging the power of Tableau, the world’s leading analytics platform and a consistent Gartner leader in analytics and business intelligence for an impressive 10 consecutive years, Uneecops, as a Tableau Gold Partner, offers unparalleled data analytics dashboard services. Our expertise in enterprise analytics with Tableau and a focus on data engineering enable us to offer intricate dashboard development tailored to your specific business needs.
Our technical expertise spans data integration, ETL (Extract, Transform, Load) processes, and the creation of data models that optimize performance and data accuracy. Our team of skilled data scientists, developers, and Tableau experts collaborates to design and build interactive, real-time dashboards that enable dynamic data exploration and analysis.
With Uneecops as a Tableau Gold Partner, you gain a competitive edge in harnessing the full potential of data-driven decision-making, making informed choices, and staying at the forefront of innovation in the analytics and business intelligence landscape.
Power BI Analytics Dashboard Solutions
Uneecops takes your business intelligence to the next level with our Power BI data analytics dashboard services. Power BI is an industry-leading platform, lauded by Gartner for 13 consecutive years, offering unparalleled business intelligence capabilities. This cloud-based analytics tool boasts immersive dashboards, seamless Excel integration, and powerful built-in AI capabilities. With Uneecops, you’ll harness the full potential of Power BI to transform raw data into actionable insights, enabling data-driven decisions that drive your business forward.
We specialize in incorporating complex calculations, predictive analytics, and machine learning algorithms, ensuring that your business analysis dashboards not only provide historical insights but also empower you with predictive and prescriptive analytics capabilities. Furthermore, our services extend to data governance, ensuring data security, compliance, and reliability, essential for organizations operating in regulated industries.
Alteryx Business Analytics Dashboard Solutions
Alteryx is a Gartner-recognized Data Science and Machine Learning (DSML) platform. In the realm of finance, where data precision and analytics excellence are paramount, Alteryx emerges as an indispensable ally. With Alteryx, finance professionals can seamlessly aggregate, cleanse, and enrich financial data from diverse sources, paving the way for robust business analytics.
Alteryx’s interactive business analytics dashboard provides a real-time view into financial performance, enabling finance teams to make informed decisions swiftly. Customizable and agile, these business analysis dashboards adapt to evolving financial landscapes, ensuring that financial leaders are equipped with the tools needed to navigate complexity.
As an Alteryx partner, Uneecops helps empower the Office of Finance to construct predictive models, automate complex financial processes, and generate actionable insights.
We now know how today’s business analysis dashboard evolved and became what it is today.
The journey of dashboards from horse-drawn to analytics automation mirrors the progress of society itself. Today, organizations have access to abundant data, and the challenge lies in harnessing its full potential. Uneecops is at the forefront of this transformation, providing the business analysis dashboard tools and expertise needed to turn data into actionable insights. As we continue to innovate and adapt, the future of analytics automation holds even more exciting possibilities for businesses worldwide.
For now, climb the bandwagon of analytics-ahead businesses and leverage dashboards to create business visualizations. Get started with Uneecops.