Safe and effective medicine. Keeping up with new healthcare emergencies. Extensive R&D. Intensive stocking and manufacturing. Clinical trials. Drug adherence. Legal and compliance protocol. Innovative medical devices. – There is a lot that Pharma businesses have to do.
In today’s fast-paced world of change, pharmacy companies must capture large amounts of data on everything from minute operative details to stock levels, drug sales, revenue, regular updates on turnover and more.
With so much on the plate, streamlining how pharma businesses research, market, and sell promising drugs becomes the key. A pharma dashboard provides real-time visibility into key operational processes, enabling better decision-making and optimization. With customizable data visualization, pharmaceutical views and real-time updates, you can monitor critical metrics such as drug development timelines, production timelines, inventory management, sales data, and more.
The pharma dashboard allows you to allows you to identify bottlenecks, track progress, and take corrective action when necessary. By streamlining and optimizing operational processes with a pharma dashboard, companies can improve efficiency, reduce costs, and ultimately bring life-saving drugs to market faster.
Data visualization pharmaceuticals’ companies have gained their competitive edge with blockbuster drugs. But as the landscape evolves, healthcare companies need to turn to different assets – data and analytics– to fuel success. Also, pharmaceutical companies have built empires on research and development (R&D) innovation. But as patent protection ends and the landscape of consumer behavior shifts, new forms of innovation must account for both top-and bottom-line growth.
Breakthroughs will require individuals to analyze data in better, newer ways.
There are many pharmacy dashboard examples available in market to monitor pharmaceutical KPIs in one place, increase profits, track production quality, prescription sales performance, and more. Many forward-thinking Pharmaceutical companies around the globe are using Tableau software for data analysis. Pharma dashboards connect companies with their customers and boost the bottom line with actionable insights. Pharma Dashboards reporting is useful for the pharmaceutical industry, providing numerous benefits like quickly identifying and addressing issues before they become major problems. Pharma Dashboards helps with improved decision-making, identifying areas of inefficiency and acting to optimize processes, making data-driven decisions that lead to improved patient outcomes, and making strategic decisions that reduce costs without sacrificing quality.
“Every company— and especially a growing company like us—wants to make decision making fast and simple. What we needed was a common platform to bring data together from all our different applications and make it visible.”
PRAMOD GOKHALE, GROUP CIO, MANKIND PHARMA
Top data trends that will share Pharma future in 2025 and beyond
The future of the pharmaceutical industry is intricately tied to the evolving landscape of data trends, as underscored below:
Increasing reliance on social determinants of health (SDOH) data
Social determinants of health (SDOH) data helps refine care models and address health inequities. The pandemic has accelerated the transition of analytics from a peripheral tool to a mission-critical asset. Through dynamic data visualization pharmaceuticals, providers can adopt a holistic approach to patient wellbeing, leveraging predictive AI/ML capabilities to optimize care plans and mitigate challenges like patient no-shows.
SDOH data also aids in guiding both traditional and emerging healthcare organizations using tableau healthcare dashboard, pinpointing areas of improvement and enhancing access to care. This growing emphasis on data-driven health equity strategies underscores the industry’s commitment to leveraging insights for transformative change.
Data for ops agility
Operational agility within pharmaceutical organizations is significantly bolstered by data analytics, facilitating streamlined operations, enhanced patient care, and optimized resource management. Data-driven insights enable healthcare entities to navigate complex challenges such as staffing, supply chain management, and revenue cycle optimization effectively.
As the pandemic spotlighted the critical importance of robust data visualization pharmaceuticals, despite advancements in healthcare IT, interoperability gaps persist, necessitating cross-industry collaboration to improve data-sharing efforts. By embracing real-time data analytics and Tableau healthcare dashboard, pharmaceutical organizations can enhance operational efficiency, improve patient outcomes, and maintain a competitive edge in an increasingly complex landscape.
Telemedicine
It represents another frontier where data analytics plays a transformative role, shaping the future of pharmaceutical engagement and patient care. Providers can harness operational visualizations on their Tableau healthcare dashboard to manage virtual care effectively, optimize delivery models, and enhance patient engagement. As telemedicine continues its upward trajectory, data surrounding efficiency, cost-effectiveness, and patient satisfaction becomes indispensable. Recent trends highlight the convergence of telemedicine and remote patient monitoring, emphasizing the need for robust data and analytics systems to ingest, validate, and analyze real-time data. This integration underscores the pharmaceutical industry’s evolving approach to patient-centric care, leveraging data-driven strategies to navigate emerging challenges and opportunities effectively.
Tableau for Life Sciences and Pharma: A Prescription For More Effective Pharmaceutical Data Analysis
Modernization and innovation are critical for healthcare. As the Pharmaceutical industry evolves, innovation and information from all corners of the organization are vital to driving success.
Revolutionizing the health experience with data helps provide more equitable, convenient, personalized, and cost-effective care for consumers. Here are more benefits of Tableau healthcare dashboard for Pharma companies:
- Be able to monitor outcomes of drug discovery
- Allocate resources and budget to current and emerging pharma markets
- Optimize marketing strategies, R&D and physician education outcomes
- Leverage global Pharma trends and tap emerging pharmaceutical markets
- Data sets that can speak with other sets give a valued birds-eye view of the whole business
- Equip users to quickly analyze data and assemble it in meaningful dashboards for efficient collaboration
- Tableau dashboard that presents data of all business functions
The biggest benefit is that Tableau for pharma will be able to manage the whole business, allowing you to invest more time in growing the business and working better for the greater good of global healthcare.
Tableau Healthcare Dashboard: 4 Strategies for Excellence
Investing in supply chain analytics enhances productivity, agility, and cost-effectiveness for healthcare organizations. Here are four strategies that integrate analytics for optimal healthcare delivery:
Enhance Analytics with AI & ML: There are many Tableau healthcare dashboard examples that showcase the capabilties of AI and ML.
Amplify your analytics using Tableau’s AI and ML capabilities, enabling contextual interaction with supply chain data:
- Explain Data: Uncover and understand data relationships seamlessly.
- Ask Data: Receive instant, visual responses to queries without manual processes.
- Data Stories: Generate narrative insights within dashboards, facilitating faster data interpretation.
- Genie: Centralize customer data for real-time, automated interactions, elevating the customer experience.
Harness IoT Value: There are many IoT Tableau healthcare dashboard examples—enabling real-time tracking of manufacturing operations, storage conditions, and warehouse logistics. They define key supply chain objectives, break data silos, enhance processes, visibility, and track KPIs like efficiency and quality.
Eliminate Data Silos: Collaborate with Snowflake and Tableau for seamless data sharing across systems, stakeholders, and third parties. This integration enhances predictive capabilities, allowing you to anticipate and mitigate disruptions based on factors like weather or labor shortages.
Embrace Self-Service Analytics: Tableau offers an interactive platform for users at all technical levels, promoting agility and resilience.
Read More: Tableau for Healthcare: Key Contributions of Tableau to the Healthcare Industry
The following is among the top templates of pharma dashboards. It showcases productivity and engagement summary dashboards used by pharmaceutical companies.
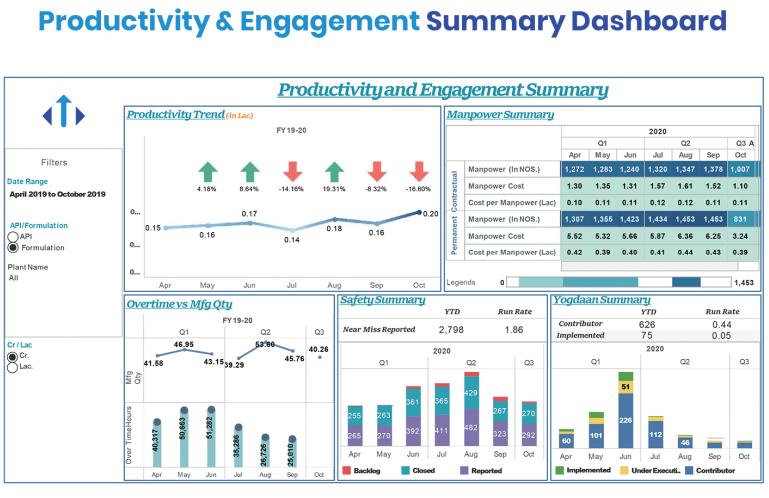
Tableau Dashboard: Pharmaceutical Businesses Best Medicine!
Pharma enterprises can enjoy improved efficiency and immediate data accessibility to compete more agilely. A critical step in maximizing the impact of data is equipping people with an intuitive business intelligence solution. Tableau utilizes the latest data visualization and business intelligence features. It empowers organizations to keep up with the dynamic technology. It is an easy-to-use software with rich functionality. Tableau dashboards provide quick insights by transforming data into engaging, interactive reports.
With Tableau for Pharma, businesses can:
- Analyze data in a few clicks: You can analyze data easily and logically as it is converted into visualizations within a few minutes.
- Create interactive, intuitive dashboards: Tableau dashboard that gives users an in-depth knowledge of the data.
- Deal with massive data: Using Tableau, you can seamlessly assess huge amounts of data.
- Publish and share data anytime and anywhere: The dashboard can be published live on the platform the user is accessing.
In the mobile world, a Tableau dashboard can be accessed on a smartphone or tablet—and the data can be available when you need it.
No software expertise is required, so anyone in the pharmaceutical business – from a salesperson to a manager – can access the Tableau software and view data in real time.
That is why, when we say Tableau is the best medicine for Pharma companies, we mean that the software is a prescription for more effective pharmaceutical data analysis.
Pharma Data Visualization
Using graph and timeline visualization makes lot of sense to pharma data. Pharma data visualization cuts through noisy data to reveal the connections and patterns you need to see. Pharma data visualization, especially network visualization and timeline visualization, helps clinicians and analysts to join the dots in pharmaceutical data. It helps companies making better decisions more quickly.
- Pharma data visualization untangles connections between patents, classifications, assignees and inventors, giving a clear overview of the intellectual property landscape
- The ability to visualize the connection between research and results avoids effort duplication, identify gaps in understanding and generally ensure better decisions
- Tableau pharma dashboards can help create easy to understand visualisations in hours, and not days. Efficiency and time saving help stakeholders grow the business and better serve their customers.
- A pharmaceutical data dashboard makes accessing data immediately possible. It can be customized on the fly, on tablets and mobile devices. Dashboards can also be reviewed and edited on mobile phones.
How Can A Pharmaceutical Dashboard Benefit Specific Healthcare Roles:
Doctors & Nurses
- A pharmaceutical dashboard helps access real-time vitals and lab results to make quicker clinical decisions
- Identify high-risk patients through early warning dashboards
- Track patient recovery progress and adjust treatment plans proactively
Medical Staff & Administrators
- Monitor bed occupancy, emergency room load, and ICU utilization with Tableau pharma dashboards
- Forecast medicine and equipment needs based on usage trends
- Use pharmaceutical dashboards to streamline inter-departmental coordination via shared performance metrics
Patient Relations & Experience Teams
- A pharmaceutical data dashboard aids in analyzing feedback and NPS (Net Promoter Score) to improve care delivery
- Pinpoint bottlenecks in patient journeys (admission, discharge, follow-up)
- Personalize communication based on demographic or behavioral patterns represented in Tableau pharma dashboards
Healthcare Data Analysts
- Conduct epidemiological analysis and outbreak pattern tracking
- Benchmark hospital performance across departments or facilities
- Enable data storytelling for executive reports and funding decisions using patterns in Tableau pharma dashboards
Pharmacy Teams
- A pharmaceutical data dashboard helps track prescription trends and optimize inventory
- Monitor drug usage to reduce over-prescription and wastage
- Ensure compliance by flagging anomalies in controlled substance use
CXOs / Hospital Leadership
- Dashboards for pharmaceutical companies help get a unified view of operations, finances, and patient outcomes
- Align resources and strategy with predictive insights
- Monitor KPIs like patient turnover rate, treatment efficacy, and cost per case
Patients (via integrated patient portals)
- View appointment schedules, reports, and treatment plans in one place
- Receive real-time updates and alerts for medications or appointments
- Understand personal health trends through simplified data visualizations
Leverage Tableau Healthcare Dashboard Analytics to Drive Value in Your Pharma Business
Uneecops’ Tableau Analytics solutions are designed to tackle the most pressing data challenges. These solutions enable you to access more healthcare and critical medicine data, analyze large chunks of information and extract valuable insights. The companies can accelerate medication discovery and development, boost the effectiveness of clinical studies, target a particular patient population, understand patient behaviour, enhance the efficiency of medicine distribution and healthcare outcomes. Our standard yet modern approach has helped Pharma companies achieve outcomes across the Pharma value chain. To read our success stories from Pharma Industry please click!