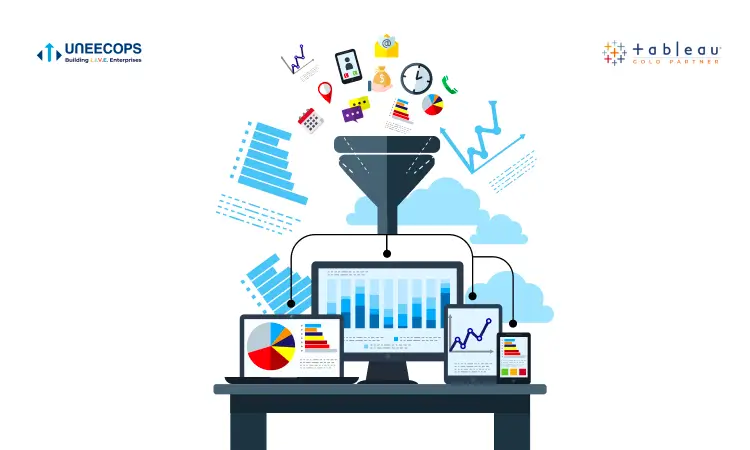
The range and types of data have expanded beyond our comprehension in the past couple of years, while we expect this data stockpiling to expand even more in the coming years. At the same time, only a few business leaders agree that they could use data to make strategic business decisions. There is a strong disconnect between companies generating data and deriving meaningful insights from that data. As companies realized the importance of Tableau software to make actionable decisions, data visualization appears to be the hottest trend among the curve.
The traditional method of viewing data such as formalized documents and spreadsheets have their limitations when faced with the volume and density of data. Visualization adds a flavor to your stories and makes it simpler for business users to view and understand important business metrics. You can communicate vital insights in impressive ways using immersive visualization catching the attention of every business user for a long time.
Storytelling with data visualization
Our eyes are immediately drawn to colors and patterns. It is easier to identify from red, blue, yellow, and distinguish a square from rectangle or semi-circle. The human brain can process visual information, recognize images much faster than any other medium. Let’s take an example of the sales pipeline, it can be illustrated with graphics about any decline in sales for any particular region or month. Data visualization communicates information than traditional spreadsheets or reports.
So, it’s hard to think about any industry that doesn’t benefit from data visualization. Whether you are in Pharma, manufacturing, city gas distribution, Food and Beverage, dairy, construction, logistics, trading, education, sports, or any other industry, the benefits of using Tableau data visualization are immense and intense.
Benefit from different types of visualizations
When you think of data visualization, the first impression you gain is simple bar graphs or pie charts. While they are essentially an integral part of visualizing data, these simple graphs are only the tip of the iceberg. There’s a massive and different type of visualization methods to communicate your message more effectively.
They are –
| Area Chart | Bar Chart | Bubble Cloud | Bullet Graph | Cartogram | Circle View | Gantt Chart |
|---|---|---|---|---|---|---|
| Heat Map | Highlight Table | Histogram | Matrix | Network | Polar Area | Radial Tree |
| Scatter Plot (2D or 3D) | Streamgraph | Timeline | Tree Map | Box-and-whisker Plots | Wedge Stack Graph | Word Cloud |
As a business user, you can use any of these visualizations and replace it with your static table or a variety of chart types that you were earlier using. Tableau visualizations are impactful, more vibrant and memorable to make a long-lasting impression.
It’s not about merely analyzing data. C-suite executives and other business leaders consistently look for information that can render useful business information just by a glance. Tableau empowers all business leaders to interpret their data through interactive elements and great visualization such as heat maps, radial tree and bubble clouds. Rich and informative visualizations help engage and inform senior management and business partners on any unforeseen risks, lurking opportunities or pending initiatives.
Do you wish to derive maximum value from a sea of streaming data with visualizations such as time series charts, heat maps and detailed pie, bar or fever charts? Our big data experts can help you arrive at critical insights and harness the tangible benefits of visualization.

