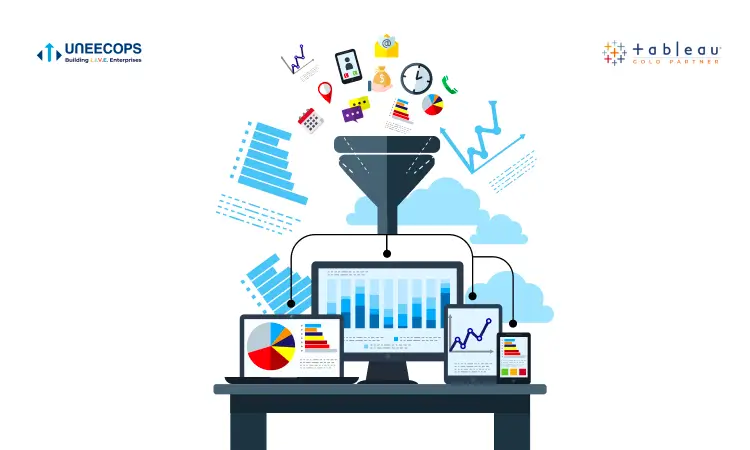
Data analysis has never been more important than now. Excel is a famous and go-to-analysis tool for many organizations worldwide, and for a number of reasons. But, as easy and useful it can be, it just can’t do all that other leading BI software can do. With pressure mounting to glean critical insights from your data, spreadsheets fall short to deliver the real-time insights you need at the moment. The good news? Tableau accommodates your ad-hoc queries in a timely fashion and helps you gain critical insights from a range of data sources.
Let us now find out how moving beyond spreadsheets and embracing Tableau is the viable call for businesses to stay on the path of success and agility.
Tableau helps to scan a million rows in minutes
Regardless of the size and scale of organizations, chances are you’re surrounded by data everywhere. Data is not just spread in spreadsheets but, it is also stored at dispersed places. It’s called big data for a reason. Social media data, customer records, internal data, video, texts, are just a few examples of this mushrooming data that can’t be analyzed with excel sheets alone. So, there comes a need to invest in enterprise-ready software such as Tableau. The software helps to scan millions of rows in a matter of time and you would be able to showcase real-time numbers and facts to your respective leaders.
Running sophisticated macros and calculations no more a hassle
Now it’s easy to run sophisticated calculations in Tableau which often makes you miserable performing in spreadsheets. Spreadsheets users can easily relate to this situation and find great relief in embracing Tableau. Now, no matter what the size of data is, Tableau ensures the process is fast and secure.
Tableau connects the dots easily unlike spreadsheets
Facing increased complexity to find the probable reasons of sales decline or a sudden surge in sales in this quarter? Or you need to know about your marketing campaigns progress or wanted to dive deep into your business to gain critical business answers? You must be facing a lot of challenges with spreadsheets. There is a better way. Tableau can help you connect the dots of just about everything. It enables you to dive deeper into all business functions without any complexity.
Convey your story to data visualization
Data visualizations are meant to depict a story just by a glance. Leading organizations are relying heavily on data visualization capabilities to gain a holistic view of their business. When it comes to spreadsheets, there are some limitations when using them as depicting your brand story. Sure, spreadsheets help you create some basic, maps, and charts, but in today’s competitive business landscape, doing this is not enough. You need a robust visualization software such as Tableau that can help you convey your brand story with ease with advanced analytics and visuals.
Avoid rework with better data visualization
You spent the whole day and night to show charts and visualizations in an upcoming meeting. You think it looks awesome.You get to the meeting and you found that there are questions that the chart or map does not address. You feel lost. People ask a set of questions and want to see visualizations on the next level. And now you have to begin it all over. Say goodbye to this situation and embrace Tableau.
Brings a variety of visualizations
How often you feel that you are bogged down with the same chart, maps or visualization from spreadsheets? Your managers are getting bored to see the same old style of representing data. Tableau gives you endless variety in terms of heat maps, treemaps, area charts, streamgraph etc.
As a business user, you can use any of these visualizations and replace them with the same old style that you were earlier using. Tableau visualizations are impactful, more vibrant and give a long-lasting impression. You can apply interesting colors, fonts, and filters in a dashboard that standard spreadsheets just don’t have.
Helps in Forecasting
Spreadsheets have their limitations when it comes to making forecasting decisions. With the smart BI software such as Tableau, it is easier to anticipate demand and supply and does forecasting of anticipated product demands on the given season, or knowing everything in details You can also use drag and drop interface of Tableau and create filters to see trends easily.
You don’t have to leave spreadsheets altogether as they have their own set of benefits. But, if you are a fast-growing business you would find Tableau as an awesome tool to use. With its self-service capabilities, Tableau is becoming a go-to analysis tool for businesses worldwide. So, whether you are in Pharma, manufacturing, city gas distribution, Food and Beverage, dairy, construction, logistics, trading, education, sports, or any other industry, you will find Tableau software benefits are hard to ignore.


