Tableau 2020.1 has plenty of new and insightful features that immediately grabbed our attention. There are many new features that everyone will appreciate, such as dynamic parameters, viz animations, buffer calculations to name a few. In this blog, we will run through some amazing features that this 2020.1 version brings about.
Let’s go through some of the coveted features of this version which make it even more interesting.
1. Dynamic parameters
This one deserves a whole lot of excitement and appreciation for the relentless efforts that have gone in simplifying it for the users. Since parameters are used in just about any visualization and the major bottleneck is that even if you refresh your data, the updated values in the parameters do not reflect. A user would have to add the new fields in the parameters manually.
This feature is clearly a great respite to all Tableau 2020.1 users as now one can automatically update the parameter’s list of values as soon as the data is refreshed. This has saved a considerable amount of time and effort required from the end users thereby giving a better analytical experience.
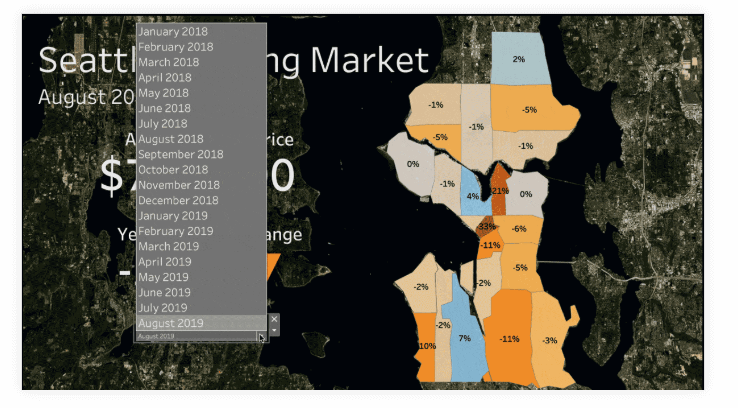
2. Viz Animations
In this smart era, we try to find easier ways of doing just about anything. It could be ordering a dress, ordering a pizza or buying any electronic items. We seek ease in everything. This concept has now been delivered to us by Tableau with new viz animations.
Now it is easy to track the logical steps behind data evolution and data stories with exact trigger points where data was impacted. This enables business users to depict the exact point of change and many a times the reason for change too. You can choose whether to turn this feature on or off. This astounding feature can be perfectly explained in this diagram.
So here it goes….
3. Explain Data Improvements
For those who are not familiar with this feature, explain data is inbuilt in Tableau which helps you go deeper into your data and ask meaningful questions. This feature gives an idea of the general direction of why and how.
Tableau 2020.1 version promised to get better and better with wide datasets. This is a feature that never fails to astonish a new user.

4. Buffer Calculations
Buffer calculations visualize the distance around point locations. It is a boundary created with respect to location, distance, map and a unit of measure. With this new feature, answering complex questions becomes easier. Simply, if you want to know how many cabs are present nearby your place, the buffer boundary highlights the number of cabs available near your location.
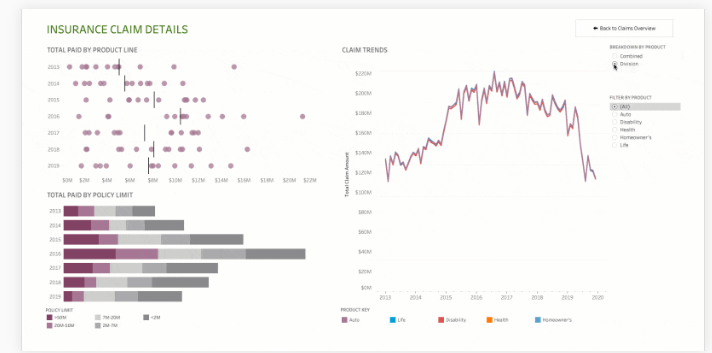
5. Export the dashboard to formats desired
This is a simple yet powerful feature which is garnering maximum attention from the Tableau users. A new dashboard allows users to export the dashboard in any format. No more hassle to users to find the tiny download option, you can directly do it at the click of a button.
You can quickly choose the desired format, image type and export the dashboard to the format you wish to work on.

So, are you excited about all the incredible features of Tableau? The latest version of Tableau 2020.1 is loaded with all types of goodies for all viz lovers. If you are interested in learning more about the robust features of Tableau, then the Uneecops team is there for you.