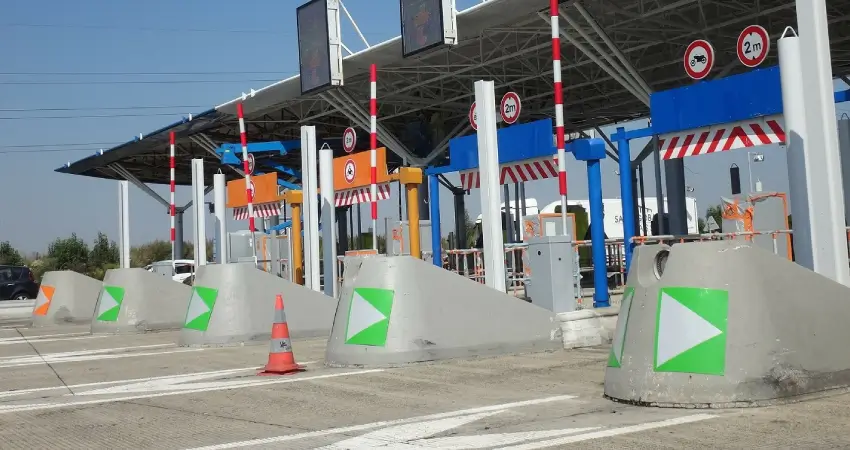
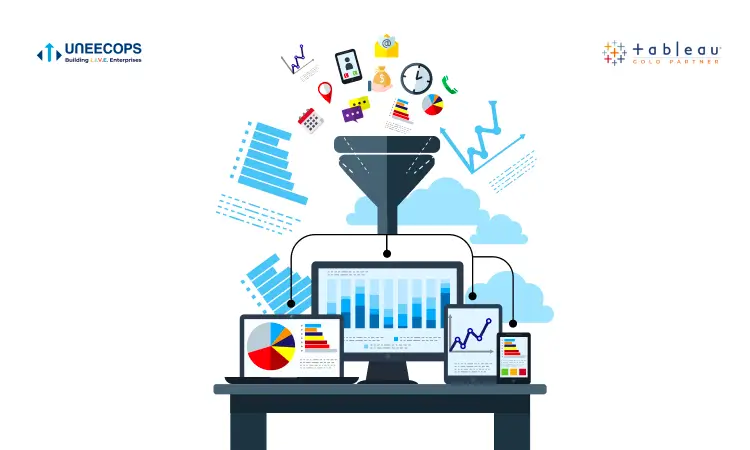
The highway and toll industry collects data at every small interval. Whether for a passenger, cargo or any fleet, this industry is deluged with data. With Tableau software, you can analyze data faster, ask various questions and dive deeper. You can uncover insights, monitor revenue per vehicle, revenue lane wise, transaction status per vehicle, and much more. You can know the percentage distribution of payment mode, make revenue analysis and most preferred revenue type.
Let’s see how Tableau empowers your business with valuable insights you need to grow your business.
1. Toll Analysis
Tableau software is deployed by concessionaires/road developers/authorities and operators to keep track of their investments. Generally, concessionaires and O&M contractors face complex challenges like pilferage by staff at Toll booths, incorrect toll-free collection, manual errors and inefficiencies etc.
The software helps in weekly and daily target vs actual trends, vehicle and lane wise traffic or revenue, loss in revenue and vehicle type (exemption), vehicle repetition (Frequent/Non-Frequent) analysis and TC wise Forced exemption. Tableau enables decision-ready data and powerful interactive visualization which is revolutionizing the highway and toll industry.
2. Revenue Analysis Dashboard
Now it is easy to make time-series comparison (vehicle type-wise), calendar month revenue analysis and shift wise contribution with this smart dashboard of Tableau. Easily perform ‘what if’ scenarios for key revenue assumptions such as contract and maintenance and gain a better understanding of how decisions will impact future performance. You can drill down collection, lane operator wise revenue collection with drill-down, and analysis capabilities. Tableau software helps you to gain personalized views of revenue information with a click of a button, anytime and anywhere. It is now easy to click on data elements or graphs to see total revenue generated, total traffic count and percentage distribution of payment mode.
3. Project analysis comparison dashboard
Tableau helps in analyzing holidays and date range comparison wise. The software helps in performing revenue, PCU & ADC. It also helps to generate vehicle wise revenue based on (TD, Holidays & Date Range). With this smart software, you can select the most preferred payment type, (Cash, Fast tag, Digital
Payment, POS, Barcode, ETC, Exempt, Violation) and keep a tab on shift wise revenue (based on TD, Holidays & Date Range) and PCU Trend Analysis.
4. AVC Accuracy Dashboard
The software helps to keep a time range wise AVC accuracy and trend. You can keep a tab of lane wise AVC accuracy percentile and vehicle class wise AVC accuracy. The software also helps in vehicle class wise faculty areas and classes.
With so many interesting features and drill-down capabilities, it is no wonder that the highway and toll industry is embracing Tableau software. Uneecops is your partner of choice to help your business maintain profitability and the keen insights you need for sustained business growth.


