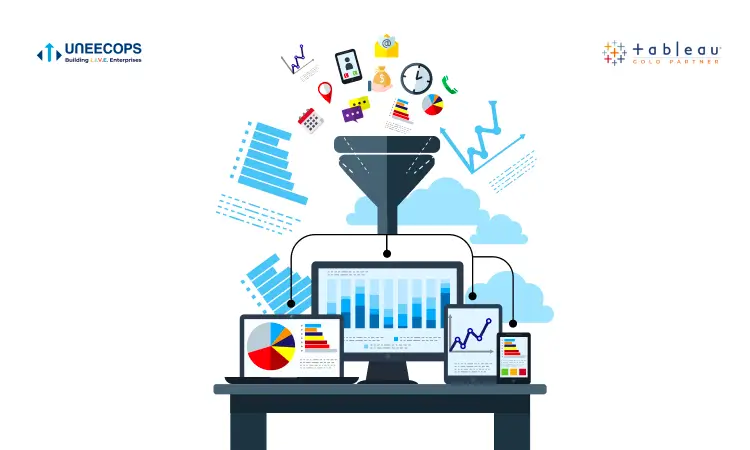
How often does your sales manager ask you about the sales being lower in a particular region? Or your finance manager is worried about the unexpected high expenses incurred in the financial month? If you are a non-Tableau user, this is the scenario you might be facing every now and then. You might be using excel sheets or spreadsheets to manage it all and to uncover all the possible details. But would they work at the granular level too? You need a robust and next-gen BI tool such as Tableau to quickly understand the bigger picture.
Let’s find out how Tableau empowers you to discover the insights in your business data.
Understand data deeply with interactive explanations
To go far beyond general trends and dive deep into an explanation, is what Tableau software is known for. The embedded statistical engine in Tableau empowers every business user to identify the areas of interest and request an explanation for the possible decline in sales, profitable venture or sudden upsurge in product demand or so. Precisely, the icon shows additional data and visualization and gives you better insight into the data you wish to understand.
For example, if you run a multi retail outlet that operates in different countries and one of your outlets is relatively unprofitable than others, with just a few clicks, you can ask for an explanation and know why it is not a profitable venture and what could be the expected reasons for the same. You can dig deeper and explore further on the areas that can be your next action points too.
Drive smart decisions based on data not instincts
Go beyond instincts and drill down faster to gain a meaningful insight of data. Dive deeper into an explanation and know the root cause. Tableau software facilitates organizations for smart decision making based on facts, and not on instincts. The software empowers all business users to see significant trends and patterns which was not possible before. It facilitates all non-technical users to find answers to their most important business questions in minutes and make decisions based on facts.
Self-service Discovery and Visualization
Ask any question and follow your curiosity. You will be amazed by the drag and drop simplicity, data discoveries and unexpected insights. Every element of this BI tool is interactive and takes users beyond the static reports. Easily dive into tableau and explore what’s happening. Whether it’s gathering insights for your manufacturing plant, inventory. sales forecasting, or gauging the performance of your department; it helps you understand more about organization than what meets the eye so that you can make confident business decisions.
Conclusion
Most businesses be it pharma, manufacturing, healthcare, facilities & mall, retail or any industry are using BI to make discoveries in every area of their business. They know that in today’s economy no enterprise can lead or win big without detailed insights into their business. Tableau helps discover opportunities before they even surface and empowers decision makers to see the bigger picture, perform ‘what if’ analysis, quickly identify patterns and trends, and understand your data at a glance.
Should you want to explore how this business analytics software can bring agility and drive profit to your business? Uneecops is a premier Tableau partner having an impressive clientele base in implementing Tableau for almost all industry verticals.