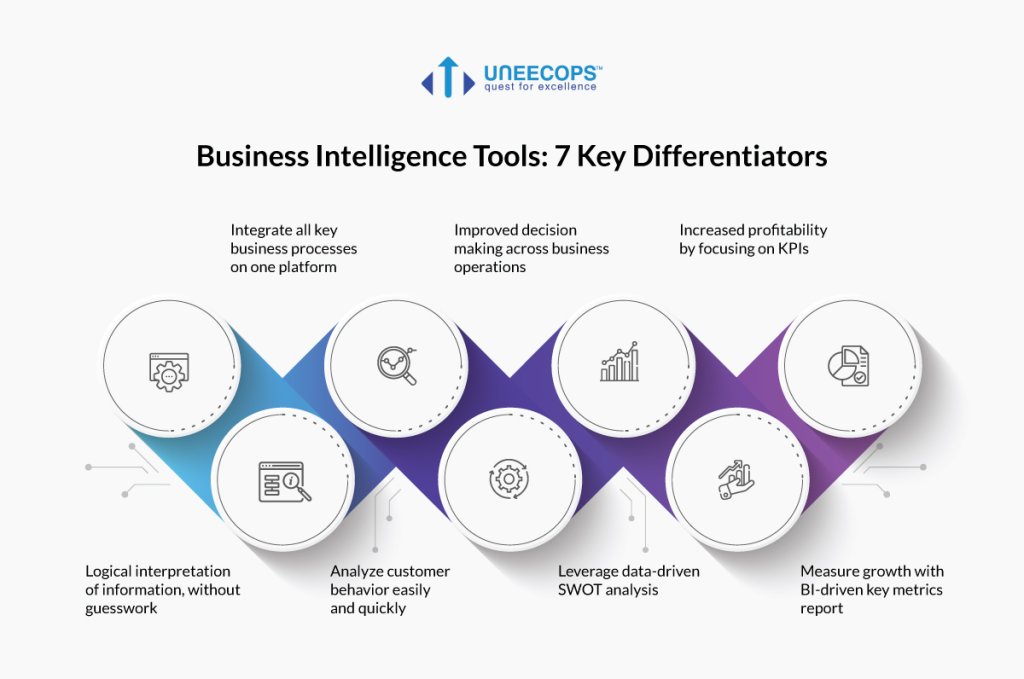
Business intelligence (BI) software offers analytics solutions used by businesses to collate, analyze, and transform data into useful business insights within easy-to-read visualizations like charts, graphs, and reports. BI entails data visualization, interactive dashboards and comprehensive reporting tools. In addition to competitive intelligence, a BI solution serves as an analytics platform for deep insights that facilitate informed decision-making.
It is established that Business Intelligence is a 21st-century business imperative.
Now, one of the most prevailing and primitive asks is the choice of Business Intelligence tool selection. To be more precise, let’s first understand the dynamics of the question, then ask queries like what one tool has to offer, offering capability, feature distinction, price volatility, interactivity, open-source/ paid tool, USPs, and the list goes on with more viewpoints. As an organization where we promote data-driven culture, helping other organizations to drive BI enablement practices, our focus is more on addressing the right need and being the guiding factor in the BI plantation journey. Over the years, we have tailored approaches to help build BI strategy, and as we say, ‘Different People, Different Needs and so are Different Goals’ which brings us to the choice of BI tool.
Building Data Intelligence is the first step
From a generic survey, let’s do some floor setting here. Ever wondered how much data your company generates every day? Or how much data is produced each day in this aggressively tech-savvy world as a whole? A recent survey suggests that people create an average of 1.7MB data every second! That’s a pretty huge figure, isn’t it?
Also Read :- Understanding Tableau Online and Its Business Benefits
Just imagine if one person is producing this amount of data, then calculating figures for your company would be beyond imagination. But that isn’t the point. How much data is being produced is not what I want to convey, but how much data is being utilized to add up to your efforts in increasing business ROI makes sense to all of us. That’s where BI comes into the picture to help visualize the same, and as we address these needs, the choice of BI tool selection surfaces which is a deciding factor in the BI ecosystem setup.

Business Intelligence Tool: Deciding factors
It’s always necessary to have a perspective about ‘know-it’ from a tool perspective. Here, we discuss the different prospects as to what could serve better and align with your set of requirements. We have listed a few significant inputs that can be explored at length but serve as a tangent to help align what we all say as ‘choice’ of tool selection.
- Functionality/ Technical offering match
- Ease of usage/ user interactivity
- Cost implication
- Market View/ Scalability
The above mentioned are just a subset of what we refer to as major factors, and surely there could be more drill-down inputs to be assessed and added to the bucket list. Let’s elaborate on each input a bit more.
- Functionality/ Technical offering match
The foremost input to consider is about ‘functionality’ matching existing requirements. This could further elaborate on data holding capability, database connectivity, features, product specifications, deployment flexibility, query support and much more.
- Ease of usage/ user interactivity
Speaking about the ‘ease of tool usage,’ it plays a very crucial role as, essentially, it is the users who are the ultimate dashboard consumers. The tool should have a rich interactive user interface to be more user-friendly and easy to get started.
- Cost implication
Next, talking about financial aspects, we also have a factor about ‘cost implication’ related to tool enablement. While I vividly stress this point as to why financial parameters should not just be the do-all and end-all deciding factor, it is a must to cater to tool capabilities as to how it adds value. However, we also have to be wary of the cost factor and understand if there is an additional cost associated that might not have been portrayed upfront.
- Market View/ Scalability
The last point we have is about the tool ‘market presence’. It is more than required to have a thorough market viewpoint, as when the product is launched, product upgrades, OEM and community support are certain to affect the decision-making process. Scalability is a long-term process, but building that in the right pathway is what we should consider, starting from the implementation stage itself.
As we mentioned before, these are subsets of the list. There is no end to the decision matrix, but these points are sure to be a guiding factor.
The Choice of a Suitable Business Intelligence Tool and Chart Selection
Here we take a quick look at ‘choice on the chart selection’. Let’s start!
The choice of chart selection essentially needs to be portrayed in the right phrase. We often use more direct data points such as a simple line chart, a bar chart or a treemap. (Happens? Right?? Yes).
Some may say this is a daily activity and that it’s based on experience or interactions (which could be true). But chart selection is about re-engineering the process for a larger audience base.
Also Read :- Tips to Select the Right Business Intelligence Tool
This could be addressed in the right approach, and when we say ‘what brings you to this choice of chart selection,’ we mean that we first need to connect what result, action or analysis we want as a derivative. Then chart selection comes in place. This is an ideal approach where we have certain output expectations and then match them with the chart display. Our primary focus is not to be confused with the just-the-chart display. Instead, it’s what result we have followed by which chart could best suffice the result we want to display. It’s a sad state of affair that we all practice it from the first chart viewpoint but try to reverse it. We need to think about what data/ result is to be derived and what chart is the best fit. This is where we need to redefine the process for a holistic approach.


