Companies generate a huge amount of data. This data contains valuable insights and info. However, the problem is that it is not humanly possible to identify usable insights just by reading pages upon pages of spreadsheets, documents or invoices. So, even if a company generates a lot of raw data, if we can’t extract valuable insights from them, it is useless. This is where data visualisation comes in. What if we can transform the spreadsheets into charts, interactive maps or plots? The data remains the same. But now, we can get a full picture from the data thanks to the visualization. We can present the data as stories with the help of these visualizations. And the cherry on top, extracting information in this way is extremely fast and saves a lot of time.
When it comes to Data Visualisation, Tableau Software is the preferred choice of most business leaders worldwide. It has been in the leadership position in Gartner’s Magic Quadrant for nine consecutive years.
Here’s how Tableau helps organisations make data-driven decisions-
The Power Of Tableau Dashboards : Easy Visualisation
Raw data has no value until it gives us insights. So, you can connect the Tableau software with your company’s sources of raw data. And, let Tableau make the heavy lifting. Once the data source is connected, you can drag and drop relevant aspects of data to the Tableau Dashboard, and Tableau will create visualisations out of the data.
Example
Tableau comes with a sample Superstore data source. It has all the relevant data like – sales, profits, products, regional managers, product categories and so on. Suppose you want to see which region and regional manager is lagging behind in sales and profits the most.
Now, to see the number of sales and profits achieved by the regional managers, you just have to drag the sales and profits data from the left panel to the columns section. And, then you drag the Regional Manager and Region data from the left panel to the rows section. And, voila! Tableau visualises which Regional Manager achieved the lowest amount of sales and profits.
So you can see that Fred Suzuki achieved the lowest amount of sales. But what is this? Although Fred achieved the lowest amount of sales, he is not the one to achieve the lowest amount of profits!
See, this is the power of data visualisation with the Tableau software. You can see the hidden insights quickly. If you have ever seen spreadsheets, you know how long it will take to come up with this kind of granular data.
You Don’t Need An Iota Of Coding Knowledge
To create visualisations in Tableau, you just have to drag and drop the relevant sections of data from the left panel. No need to manipulate data with any coding. Tableau uses VizQL, which is a visual query language. It transforms your drag-and-drop activities into traditional SQL queries, thereby eliminating the need to learn working SQL databases.
Tableau Is Now Equipped With A Powerful Data Cleansing Tool
Whenever we talk about the ease with which Tableau visualises data, there are some people who say, “But what about data cleansing? Without it, even the Tableau dashboards can’t visualise data properly.” Well, the good news is, Tableau is now packed with a powerful data prep tool known as Tableau Prep. So, you no longer need to take the help of any third party data cleansing tool. Tableau Prep is there for you.
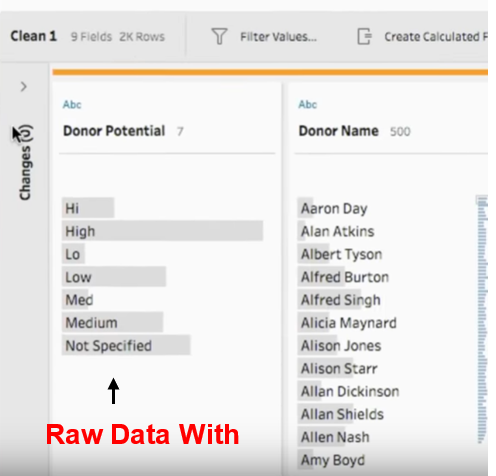
For example, look at this sample example published on the Tableau Software official YouTube channel.

In this example, there is a list of donors who donated to a charity. One column of that data indicates how likely a donor is going to donate again. The problem is – there should be three values – High, Medium and Low. But the raw data has values like Hi, High, Medium, Med, Lo, Low. To clean the data, we have to merge Hi with High, Med with Medium, Lo with Low.
With Tableau Prep, you can do that with the magic of drag and drop. No need to fumble with any Excel code. Just click on the value – Hi and rename it to High. The data associated with the value – Hi will be merged with the value – High. We can do the same thing for Med and Lo.
Tableau Can Handle Loads Of Data
Tableau came up with Tableau Online in 2013. It is the same old Tableau but hosted in the cloud. And unlike Tableau Server, the hosting of Tableau Online is managed by the Tableau Software company itself. So you don’t need to spend a dime on hardware and security. Access it from anywhere. You just need a decent internet-enabled laptop or mobile with a browser.
Tableau is perhaps the easiest of BI tools ever made. If your company isn’t leveraging Tableau yet, it’s time to do so. If you are afraid to take the first step, we at Uneecops can guide you in every step of Tableau implementation. Once implemented, you’ll fall in love with those pretty and insightful Tableau Dashboards.
Tableau In Your Pocket
You can view and work on Tableau dashboards on your mobile using Tableau mobile. Log in to your licensed Tableau Server or Tableau Online edition and create dashboards, present impactful presentations even when you are inside an elevator.
Tableau Is A Full Fledged SaaS Software: No Need To Maintain Additional Hardware To Run It
Tableau came up with Tableau Online in 2013. It is the same old Tableau but hosted in the cloud. And unlike Tableau Server, the hosting of Tableau Online is managed by the Tableau Software company itself. So you don’t need to spend a dime on hardware and security. Access it from anywhere. You just need a decent internet enabled laptop or mobile with a browser.
Tableau is perhaps the easiest of BI tools ever made. If your company isn’t leveraging the Tableau yet, it’s time to do so. If you are afraid to take the first step, we at Uneecops can guide you in every step of Tableau implementation. Once implemented, you’ll just fall in love with those pretty and insightful Tableau Dashboards.
So, Why Use Tableau Over Other BI Software?
The first and the most important reason to prefer Tableau over others is its intuitiveness. It is made keeping the regular users in mind – users who don’t code. With its drag and drop magic, anybody can be a Data Analyst – and a good one at that. One of the phrases that we often say when we talk about Tableau is – ad-hoc data analysis. You throw data in Tableau, and it will visualise it within seconds. At the same time, Tableau is great for power users as well.
Tableau is a platform-agnostic tool. You can run it on Linux, Windows, internal on-premise servers, public cloud and even as a standalone SaaS application. This ensures that even if your organisation changes its platform in the future, you don’t need to worry about compatibility issues.
With Tableau, scalability is not an issue. Compared to other BI tools, Tableau requires significantly fewer hardware additions in case you want to scale up the system. Talking about the system, Tableau is a wholesome software. Everything is already there. For general tasks, data preparation and data analytics, you don’t need to fumble with third-party apps and extensions. The system fits beautifully with the internal IT architecture of the organisation.
This comparison will be incomplete if we don’t talk about the community support that comes with Tableau. With an active community of 220,000 active users, Tableau has forums, groups, extensive tutorials and even a subreddit. So, you won’t feel lost. Also, Tableau is one of the most popular BI tools. There is no scarcity of top talents to leverage Tableau to turn your organisation into a data-driven one.


