Data Visualization Services that Unlock Steady Stream of Insights

Request a Demo

Tableau plans

  • Creator

    Every deployment requires at least one Creator


    Powerful Suite that supports end-to-end analytics workflow & provides business
    insights.


    Includes: Tableau Desktop, Tableau Prep Builder, and one Creator license of Tableau Server.

  • Explorer

    Every deployment requires at least one Explorer


    Full self-service analytics pack that lets you explore trusted data & answer
    your question faster.


    Includes: One Explorer license of Tableau Server.

  • Viewer

    Every deployment requires at least one Viewer


    Ease to use & secure visualization platform that lets you view & interact
    with dashboard.


    Includes: One Viewer license of Tableau Server.

modern-footer

Data Visualization Software Solutions
To Help Businesses See Through Their Data

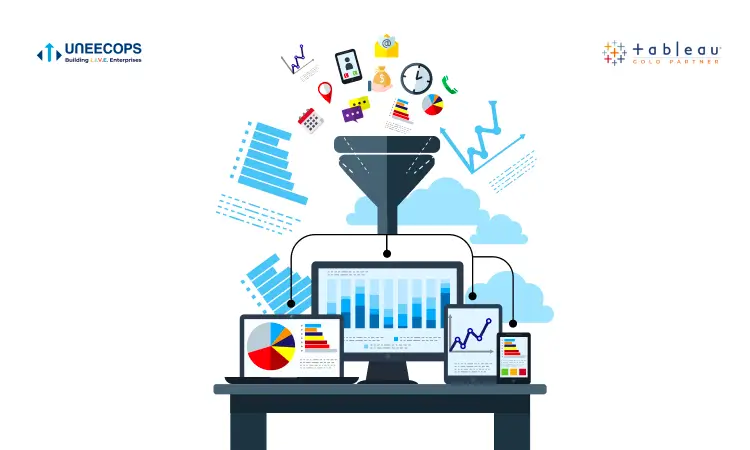
With more data available from disparate sources and streams, businesses need a better way to synthesize meaning from it. Telling a story with interactive charts, heat maps, histograms, cartograms, scatter plots, and infographics can be a competitive differentiator. It quickly guides business leaders to identify and mitigate risks as well as uncover valuable opportunities just by a glance.
Our BI development service experts understand that human minds can process and grasp visual information more easily than data in reports. As the top data visualization company, we help all fast-growing organizations to convey their complex concepts and identify new patterns in data seamlessly. Our data visualization services help you to present your story in a “short-attention-span” world in the simplest way possible.

Group 99010

Analyze Processes

Our Tableau software experts start by analyzing business processes and interview all business leaders to understand their goals & performance

Group 106166

Create Story

During the creation process, experts team uses robust visualization techniques and experience to reflect the true enterprise story

Group 104746

Design Visualization

Our tableau data visualization team understands the importance of user design which is critical to achieving stunning visuals.

Group 106512

Training and Go-live

Experts give you formal training so that you can simplify and synthesize complex data through dynamic and descriptive visualizations

Take your data anywhere and unlock insights on-the-go with Mobile BI dashboard services

Being able to gain critical business insights on the go is key to making better decisions. Our data visualization services facilitate business users to gain a complete and 360 view of the organization at their fingertips with Mobile BI functionality.

Witness on-the-go Tableau data visualization with Uneecops

Optimized for touch, our Tableau data visualization experts help you select, filter, zoom, scroll and drill down with a tap of a finger.

  • One-click storytelling and automated discovery
  • Make more informed, faster decisions wherever you are
  • Gain access to data whether or not you’re connected to your network
  • Tableau data visualization solution is optimized for whatever device you’re using

Data Visualization Services for Every Industry Vertical

The journey to visualize your data with Alteryx, Power BI or Tableau dashboards is worth exploring by every entity in every industry that seeks to achieve deeper, faster and meaningful insights that can strengthen decision-making. As a data visualization company, we help 21+ industry verticals transform the way they use data to solve their unique business hurdles and gain actionable insights.

Retail

Retail

Tableau data visualization solutions help our retail clients understand their customer buying behavior, perform purchase analysis, know unique visitors, product quantity sold and know average abandoned value. They are also using Tableau software to perform visitor analysis, know average sales value, sales conversion rates and more.
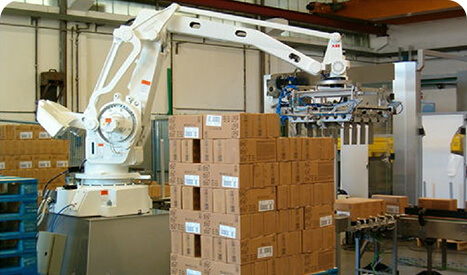
Manufacturing

Manufacturing

Leading manufacturing firms seek data analytics and visualization services to perform production analysis, analyze root causes, spot sales opportunities, win rate analysis, sales projection, point of sale actuals over time, monitor open orders and inventory levels, and gain multi-level visibility into supplier quality, cost and resolve issues in real-time.

Pharma

Pharma

Gain real time-visibility over current stock, negotiate better with vendors, manage different business functions and improve collaboration between manufacturing, sales and distribution. Our BI development service experts enable Pharma companies to improve the speed of decision making, perform root cause analysis, control expiration rates and augment the quality.

Banking

Banking

Banks and leading financial institutions can use our data visualization services to gain insights on sales performance, profitability attribution, branch performance and more. Banks can also strengthen risk management by performing spatial analysis, margin analysis, delinquency analysis, loan product category, loan portfolio performance, loan status, credit pipeline forecasting and trend analysis.

High-Tech

High-Tech

With fast performance and intuitive data visualizations services, tech companies can understand high volumes of data in minutes, easily understand product trends, perform ad-hoc analysis, plan product release, level up the performance of all departments, and discover hidden insights in their data.

Food & Beverage

Food & Beverage

Predict extreme spike in demand, monitor waste management, identify product availability, and manage end to end supply chain. Identify issues across stores, maximize return, ensure customer loyalty, and make profitable decisions daily with our data visualization services. Begin with Alteryx, Power BI or Tableau data visualization consulting services.

https://www.uneecops.com/wp-content/uploads/2022/12/serviceportfolio-1.webp serviceportfolio-1-m

Quickly analyze your geospatial data

Know More

Location-based Analysis

https://www.uneecops.com/wp-content/uploads/2022/12/serviceportfolio-2.webp

AI-driven analytics and predictions to your CRM

Know more

Analytics across functions

Case Studies

bakers-circle bakers-circle

Bakers Circle Accelerated its Production & Distribution Processes with SAP Business One® SAP Business One®

Industry

Wholesale Distribution

Employees

~300

Revenue

~100cr

Location

Jasola, Delhi, India
DOWNLOAD
READ MORE
coldex

ColdEX Logistics Improved Supply Chain Management, Warehouse and Fulfillment Management with SAP Business One® SAP Business One®

Industry

Logistics

Employees

250

Revenue

400 Cr+

Location

(Gurgaon, Haryana, India)
DOWNLOAD
READ MORE
sevcon sevcon

Energy Expert Sevcon Embraced Technology to Fuel Growth and Power Productivity with SAP Business One® SAP Business One®

Industry

Professional Services

Employees

30

Revenue

20 Cr

Location

(Nehru Place, Delhi, India)
DOWNLOAD
READ MORE
clearpack clearpack

Clearpack Automation Managed their Production Cost and Timelines with SAP Business One® SAP Business One®

Industry

Machinery & Components

Employees

300

Revenue

~100+cr

Location

(Uttar Pradesh, India)
DOWNLOAD
READ MORE
gopal-corp gopal-corp-case-study

Quick Deployment and High ROI as Gopal Corporation Embraced the Cloud with SAP Business One® for HANA SAP Business One® for HANA

Industry

Consumer Products, Wholesale Distribution

Employees

~800

Revenue

~500cr

Location

(Patparganj, Delhi, India)
DOWNLOAD
READ MORE
revex-group-logo revex-group-case-study

Revex Group Evaluated its WIP Stock and Improved Production Planning with SAP Business One® SAP Business One®

Industry

Chemicals, Manufacturing

Employees

250+

Revenue

80 Cr+

Location

(Naraina, Delhi)
DOWNLOAD
READ MORE
slide-1-1024x640-1 (3) (1)

S.B. Packagings Touched New Heights of Production with SAP Business One® SAP Business One®

Industry

Manufacturing

Employees

100+

Revenue

19.2 M

Location

(Paschim Vihar, Delhi)
DOWNLOAD
READ MORE
pankaj-electronics pankaj-electronics-

Pankaj Electronics Streamlined its Inventory Management with SAP Business One® SAP Business One®

Industry

Wholesale Distribution, Manufacturing

Employees

90

Revenue

102 Cr+

Location

(Noida, Uttar Pradesh)
DOWNLOAD
READ MORE
Orbit-Logo orbit-case-study

Orbit Techsol Mitigated Serial Number Traceability and Other Challenges with SAP Business One® SAP Business One®

Industry

IT Services

Employees

~130

Revenue

~350cr

Location

(Okhla Ph-1, Delhi, India)
DOWNLOAD
READ MORE
mankind mankind-pharma-

Mankind Pharma Managed BMR/BPR and Inventory with SAP Business One® SAP Business One®

Industry

Manufacturing

Employees

10,000+

Revenue

5,000 Cr+

Location

(Ponta Saheb, Punjab )
DOWNLOAD
READ MORE
jivo jivo

Jivo Wellness Streamlined its Import and Distribution Activities Globally with SAP Business One® SAP Business One®

Industry

Trading

Employees

90+

Revenue

120 Cr+

Location

New Delhi
DOWNLOAD
READ MORE
haryana-leather haryana-leathers

Haryana Leather Chemicals Synchronized their Inventory, MRP and Production Processes with SAP Business One® SAP Business One®

Industry

Chemicals, Wholesale Distribution

Employees

~60

Revenue

~50cr

Location

Jind, Haryana
DOWNLOAD
READ MORE
Fujikura fujikura

Fujikura Kasei Coating Painted a New Route to Success with SAP Business One® SAP Business One®

Industry

Manufacturing

Employees

25+

Revenue

25 cr

Location

(Haryana)
DOWNLOAD
READ MORE
btn-left btn-right

Find the story hidden in your data with our data visualization software

Let’s show you how

Request Demo

Data Visualization: Frequently asked questions

Data visualization is the graphical representation to present data in a more interesting way. Our eyes are immediately drawn to colors and data visualization symbolizes visual art that grabs our attention. We comprehend data better when we see pictures rather than a number of rows and columns. While visualization data in Tableau, we can ask pertinent questions like “ Why are my sales declining in a particular region?” “ What is fostering growth” and “Where do I need to stop to improve profitability.? ”
The main goal of data visualization is to enable business users to analyze trillions of row of data in a matter of minutes. Data visualizations help all users especially business leaders to understand data in a never-imaginable way. It makes data easier to absorb and removes the chaos from data depicting useful information precisely. Millions of rows of data can be boring to capture any attention or make a powerful statement. Tableau conveys information by combining great analysis with great storytelling.
Tableau helps examine trends, outliers and helps you understand patterns in data. It helps analyze massive amounts of data and make informed decisions faster. If you have ever looked at a massive excel sheet, you would know how intricate is to analyze a trend. Thanks to Tableau data visualization analysis and storytelling and exploration are just a walk away now! Tableau data visualization helps business leaders by influencing their thoughts and actions to make informed decisions at critical points.
Data visualization brings data to life revealing hidden insights while translating millions of data and rows into impact. When you choose the right data visualization tool like Tableau, it illuminates insights and helps you make smarter decisions and the best outcome for your business. Further, data visualization is helpful when for data analytics because it is an excellent means for users to present data to non-technical audiences with ease and without any confusion.