All businesses have ample data. But did you ever wonder what translates that data into information?
When data comes to life, it becomes real information. In the informative, technology-driven and digital age, those businesses that use quantitative data to foster qualitative decision-making will survive and thrive. How do you achieve this?
The one answer – DATA VISUALIZATION.
It is said that “a picture is worth a thousand words.” The old saying has become more relevant. Nowadays,it is not just the tech or IT companies that require data visualization or data analysis. Today, all businesses need to interpret business information to facilitate informed decision-making. This is what we call business intelligence or BI. Data visualization is one of the most critical tools of BI. This article will focus on data visualization through the prism of business intelligence.
What is Data Visualization?
Data visualization involves the conversion of raw information (text, numbers or symbols) into a visual or graphic format. The data visualized contains various forms of data interpretations like pie charts, comparison bars, demographic maps, and much more. In other words, when visuals are used to tell a story through data interpretation, it is called data visualization!
Data visualization is a widely used method to introduce information for users through the BI interface (data representation tool). Data visualization tools provide an accessible way to see and analyze trends. They help understand massive amounts of information and make data-driven decisions with Data visualization.
How is Data Visualization Used?
Today, data visualization is not a standalone practice. You do not need to create visuals manually. In fact, data representation tools are a part of the BI services software. These BI interfaces have data visualization templates that you can use or modify to present and interpret data.
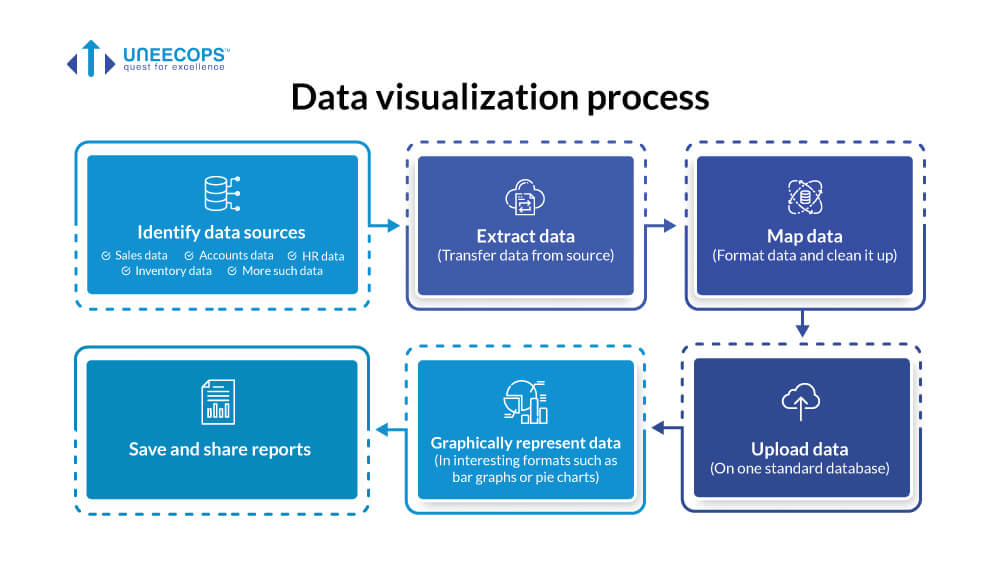
So, how is data visualization used in a 21st-century business context? There are various steps involved in the process. The image below shows a clear picture.
Data visualization process
- Identify data sources
- Sales data
- Inventory data
- HR data
- Accounts data
- More such data
- Extract data (Transfer data from source)
- Map data (Format data and clean it up)
- Upload data (On one standard database)
- Graphically represent data (In interesting formats such as bar graphs or pie charts)
- Save and share reports
With this, you get clarity on where data visualization actually takes place in the whole process.
Data Visualization Benefits:
We have established that all businesses require data visualization. Now, let us look at the benefits of data visualization:
- Make sense of all the data
- Key to advanced analytics
- Heighten the impact of information with strong presentation
- Spot emerging trends
- Trace a company’s performance across key indicators
- Discover areas that require attention
- Visualizing business data to convert trends into strategies by making sense of your information.
- Revealing previously unnoticed vital data sources to help decision-makers curate effective data analysis reports.
In a nutshell, data visualization helps convert ‘chunks’ of data into meaningful business information.
Why is Data Visualization Required for your Business?
We have understood the data visualization benefits. How does this help your business in today’s times? Find out:
- Absolute absorption of large and complex business data
You can grasp large volumes of data and use it to your advantage. This is because better visual representation is much easier than analyzing large text or numbers. Companies can also appreciate the interrelations between different data points. Suppose you have systems in your organization to collect data but no effective way to present it to leaders; you are unlikely to get the expected business benefits.
When you are able to make yourself and your team visualize data, SWOT analysis of the business is possible (Strengths, opportunities, weaknesses and threats). After that, key decisions can be made easily and rapidly.
- Data-driven decision-making
Organizational teams that discuss visual data tend to reach consensus. Data visualization helps enterprises reach decisions quickly and enables viewers to glean far better insights about patterns and trends.
- Better audience engagement
Good visual presentation is always more engaging. For example, during a sales presentation, data that showcases your strengths, when presented visually, goes a long way in building credibility and persuading. Similarly, visualization enables communication and collaboration among company stakeholders. They can view, appreciate and discuss insights from data effortlessly.
- Reveals hidden patterns and deeper insights
Data visualization helps unlock trends and patterns that are not easily discernible from traditional forms of representation. Deeper insights and appropriate forecasts can be obtained through data visualization.
For modern businesses, cutting through the competition is a key agenda. Using data visualization, companies can understand their operations, identify bottlenecks and pinpoint areas that need improvement.
Preferred Data Visualisation Solution Providers
Big data can turn into bad data if you don’t visualize it right! Uneecops Business Solutions (UBS) understands the power of data. We aim to help organizations turn their data into information and actionable insights. With over 10 years of data science experience, UBS offers a comprehensive suite of business intelligence solutions. We are a CMMI Level 5 company and one of India’s most reputed BI services companies. Being a thought leader in analytics and business intelligence, UBS enables businesses to uncover new patterns and insights with visual context, trends and correlations. We use interactive dashboards to help companies visualize data in engaging, interesting formats. You can create data visualizations that will best serve your business objectives.
Our experts also support enterprises to create custom geo-analytic reports using location-based data combined with powerful analytics, which puts information at your fingertips. We lay the foundation for accurate data visualization through our BI services. Our key BI product offerings are Tableau and Microsoft Power BI.
See the real, practical and precise picture of where your business stands. There are thousands of stories to unfold. If you would like to interact with data and grow your business in the 21st century, partner with UBS. We can support your business in creating more sophisticated visualization techniques for more extensive and larger datasets. Ultimately, you gain business intelligence and develop proven ways of doing business. Success is just a matter of apt data visualization!