The Food and Beverage industry is a dynamic and competitive industry. It’s ever evolving primarily influenced by the fast changing consumer preferences and technology. Industry insiders will tell you how fluctuating the F&B industry is.
Just like any industry, if an F&B business wants to survive, it has to look for ways to gain a competitive edge over its peers. This is where Tableau comes in. It provides a bird’s eye-view of your business. From sales to supply chain, from compliance to analysing customer behaviour – it helps you keep track of a lot of data.
But before we jump in to discussing the benefits of Tableau, let’s discuss some of the pain points of the F & B industry.
- Today consumers have become health conscious. Hence, traditional carbonated, sugar-mixed beverages are losing their sheen. Companies have to come up with innovative products that are branded as healthy as well as delicious. However, not all innovations succeed. So there is a need to minutely analyse what works and what doesn’t.
- Due to the raging pandemic, the supply chain across the world has broken. You can’t rely on one or two raw materials suppliers any more. Along with that, you have to order raw materials keeping in mind the lockdown situation, transport and cargo situation, etc.
- Along with this, there is a great shift in the way consumers buy food products- especially fast food. The selling journey is no longer just a simple manufacturer-distributor-retailer engagement. It is necessary to keep track of all the channels. What works online won’t work offline.
Along with these, there are usual pain points of compliance and audit, employee productivity tracking and stock analysis.
Tableau Can Remove These Pain Points
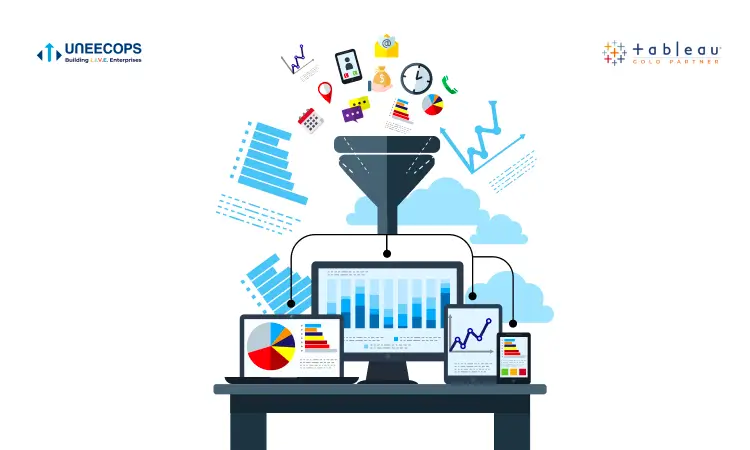
Tableau is a data analytics software that helps your organisation use visual analytics and business intelligence to combat any complex challenge and make decisions for the best of your organisation. It collects historical and present data, analyses raw information and gives you insights that help make appropriate business decisions. It is one of the best available analytics and business intelligence tools.
1. Use Tableau To Know The Psychology Of Customers
Customer behaviour is changing every month. As a result of the pandemic, many customers are rethinking their food and beverage choice. They no longer want to consume fast food with high fat or cholesterol content. Companies have to experiment with newer products that are marketed as ‘diet’ or ‘healthy.’ But since these are uncharted waters, companies very often fail to understand the pulse of the customers.
Tableau can help companies find hidden insights from customer data. For example, you might see an overall dip in the consumption of Product A and an increase in the consumption of Product B. However, if you look at the granular data, you might find that in some states or areas, people are still consuming more of Product A than Product B. But this kind of granular data often hides behind the seeming truth. The reason is that you can’t get granular insights from Excel sheets. This is where data visualisation software like Tableau comes into play. With other software, you have to fumble and do a lot of scripting to visualise such granular data. But with Tableau – all it takes is drag and drop! You can visualise complex data within minutes!
2. Move Towards Greater, Company-Wide Transparency
With Tableau, a company can access data readily across all its channels or branches. The concerned departments can take actions based on emerging trends since that data is automatically updated and reaches throughout the organisation. Tableau Server helps publish dashboards across the organisation for internal usage that becomes one source of truth for the entire company and employees.
3. Get Accurate Forecasting of Sales Before It Happens
Tableau provides rich time series analysis to understand various aspects of your company, brand or product and services such as seasonality, trends, data sampling, predictive analysis, forecasting and other common time-series functions within a robust UI. In addition, Tableau helps both the data scientists and the end-users with its complex configuration and simple interactive modelling.
For example- This is the second year of the pandemic. Among all the darkness, the saving grace is that we have historical data of what happens when the supply chain gets disrupted during a lockdown in places where our suppliers reside. We can use the predictive analysis of Tableau to look for hidden insights. We can even merge the coronavirus infection data to predict if any of our suppliers will face a lockdown in their area. This will help us look for alternative suppliers even before the supply chain is disrupted.
4. Reduction In Report Creation Time
PepsiCo, one of the leading beverage companies, uses Tableau Desktop for analyzing inventory, logistics, and financial data. This analytics and business intelligence tool helps the company comprehend big data and empowers analysts to create a strong supply chain and predict reports in record time.
PepsiCo reduced report production time by 90 using Tableau and end-to-end run time analysis by 70%. Today, the company has gained a competitive advantage in the retail industry and offers the best service to the customers using the faster and accurate reporting system of Tableau.
5. Gain Insights On Every Single Sales Channel
This is the era of ecommerce and multi-channel sales. You have to gain insights into all of the channels. This can get chaotic if we use Excel sheets and basic accounting software. Even if you manage to report and record the sales details on a channel by channel basis, that report won’t be useful until you can gain insights from it. With Tableau software, you can merge and compare separate data to gain hidden insights that remain elusive if you work on the data separately.
6. Gain Holistic As Well As Micro Insights
A company has to keep track of the sales data and customer behaviour on a high level scale as well as on a narrowed down basis. Tableau can obviously visualise high level data like year on year and month on month sales or changes in loyalty to a particular product. But you can see the power of Tableau when you realize that you can visualise data to its last morsel. For example, you might want to see during what hours your company sells how many bottles of soda before and after ThanksGiving and Christmas. Earlier, if you needed this kind of micro insights, you had to take the help of a data scientist. But with Tableau, anyone can visualise and analyse such data.
7. Easily Track Employee Productivity Without Fumbling Through Sheets Of Data
Track how many orders an employee served. Keep track of spend/guest and spend/check – just by dragging relevant employee data on the rows and columns section of Tableau. You can compare employee productivity and look for areas of improvement.
With the above points and examples of some big players in the F&B industry, it is clear that, undoubtedly, Tableau brings agility and boosts the business’s profitability. The present world being a digital landscape, business intelligence tools like Tableau answer all your business needs.


