Your business journey into the future must start from where you want to be to where you are now. This calls for reporting. Each person to their reporting manager, each department to functional heads, and all heads to directors – reporting trickles down to every organizational level. In the 21st century, enterprise reporting calls for automation and business intelligence. Tableau is the world’s #1 analytics platform and a widely used BI tool. The software helps businesses understand customer needs by building Tableau business dashboards and Tableau reports to analyze customer requirements. As per the 2021 Gartner Magic Quadrant, Tableau is recognized as a leader in data reporting for the 7th consecutive year.
An in-built feature of the BI service tool, Tableau business reporting helps users visualize data to better understand how far they have reached their goals and predict future plans.
This blog will dig deep into BI service, Tableau dashboards and the benefits of Tableau reporting. Read below to explore Tableau reporting tool with Tableau report example.
But first, let’s get the basics right!
Introduction to Tableau business reports
Reporting is done to analyze data. This also requires the correct portrayal of data in a report.
Tableau software helps collect, sort, visualize and interpret information. Raw data is converted into actionable insights using tables, charts, maps, graphs, etc. Tableau reporting tool also lets users view data trends and patterns, study forecasts, as well as understand data at a granular level.
Tableau business dashboards and Tableau reports can be shared in varied formats like spreadsheets, pdfs, tables, custom dashboards, workbooks and more.
How does Tableau business reporting work?
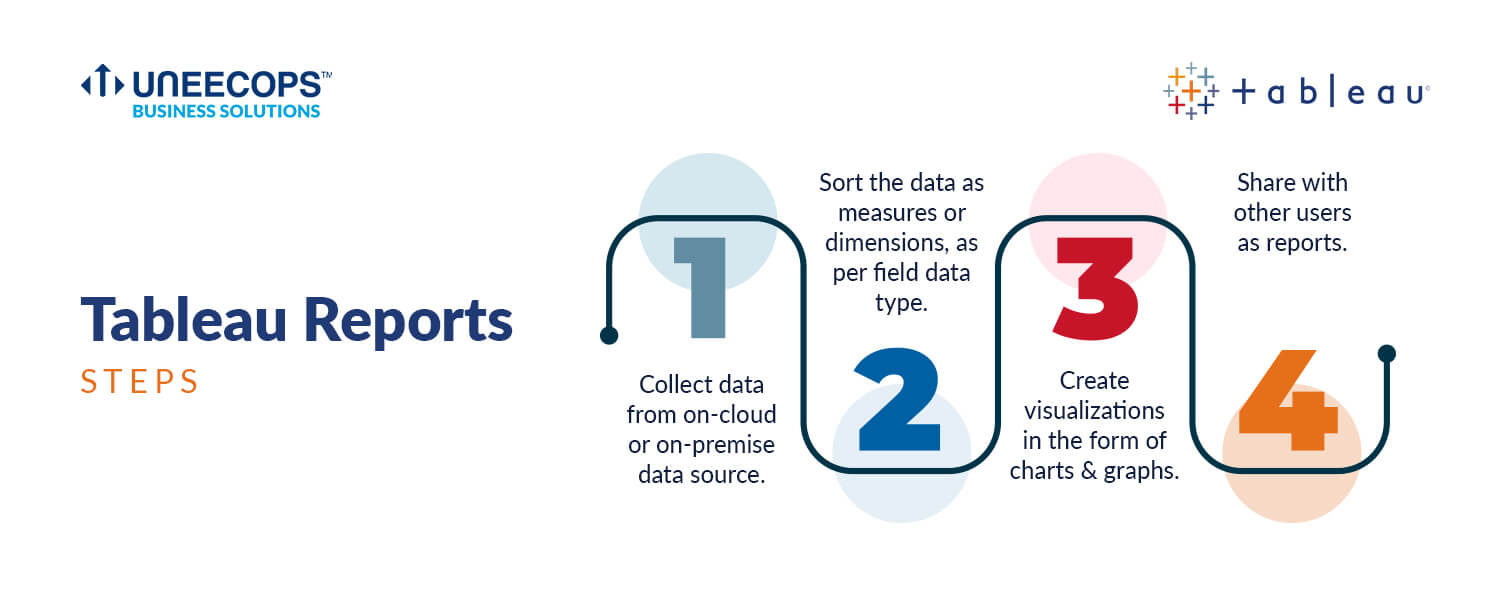
Take a look at the image below to understand the working of a Tableau business report. Also, learn Tableau reporting examples and how you can automate Tableau reports.
Benefits of Tableau Reporting
At the end of the day, the aim of report creation is to generate valuable data insights and aid data-driven decision-making in a business. Tableau is enriched with user-friendly features that make reporting easier and faster.
Tableau reporting takes data silos out of the equation as all the users work together towards one vision on the same platform i.e. Tableau software.
Looking for more answers?
Here are the in-depth benefits of Tableau reporting:
Easy, effortless reporting
No IT expertise? No worry! Tableau reporting tool has a simple drag-and-drop interface that makes the platform easy to use. All users can seamlessly visualize data and focus on finding value in data. Tableau instantly translates information into visually engaging insights as well as interactive dashboards.
Speed to Market
Reporting within minutes and seconds! Tableau has made it possible to analyze data uncomplicated and quick. This saves time and speeds up decision-making within the organization. It adds a competitive edge by rapidly meeting the complex demands of the market.
Big Data Analysis
Tableau’s in-memory analytical engine generates reports, dashboards, stories, etc. It uses all the machine memory for analyzing big data super fast.
Connection to All Standard Data Sources
Tableau provides native connectors that enhance the performance of popular databases. These native connectors leverage the data sources’ capabilities and enforce security protocols.
Adding new data sets from a database, excel workbook, or any other database is simpler. Using standard fields, Tableau combines these data sets automatically.
R Integration
Newly created calculated fields in Tableau dynamically call the R engine and pass the resulting values to R. Proficiency in R allows users to implement its visualization capabilities and perform better statistical analysis.
Plug and Play Functionality
Creating reports in Tableau is as simple as drag-and-drop! Ensure seamless integration into your existing data infrastructure with compatibility in your security and governance framework—no additional infrastructure is needed.
Intuitive User Experience
Empower non-analysts to effortlessly query and generate the insights they seek, fostering a user-friendly experience.
Customizable Dashboards
Grant all users the ability to craft visually compelling insights at a glance, promoting a dynamic and personalized reporting experience.
Scalability
Tableau reports flex with your business growth, adapting effortlessly to expanding needs without compromising efficiency.
Best Practices for Tableau Reporting Success
While reporting in Tableau is inherently tailored to your company’s unique needs, adhering to established best practices enhances its effectiveness:
Targeted Audience and Permissions: Tailor Tableau reports to the correct audience, collaborating with IT to establish meticulous permission settings.
Analysis-Oriented Report Preparation: Develop reports with a focus on easy comprehension, ensuring they are structured for effortless understanding.
Mastering Data Visualizations: Acquire proficiency in creating impactful data visualizations to enhance the communicative power of your reports.
Adaptability to Change: Embrace technological advancements and adapt your BI reporting process to evolving business requirements, ensuring long-term relevance.
We’ve got the theory! Check out Tableau reporting examples and sample dashboards below.
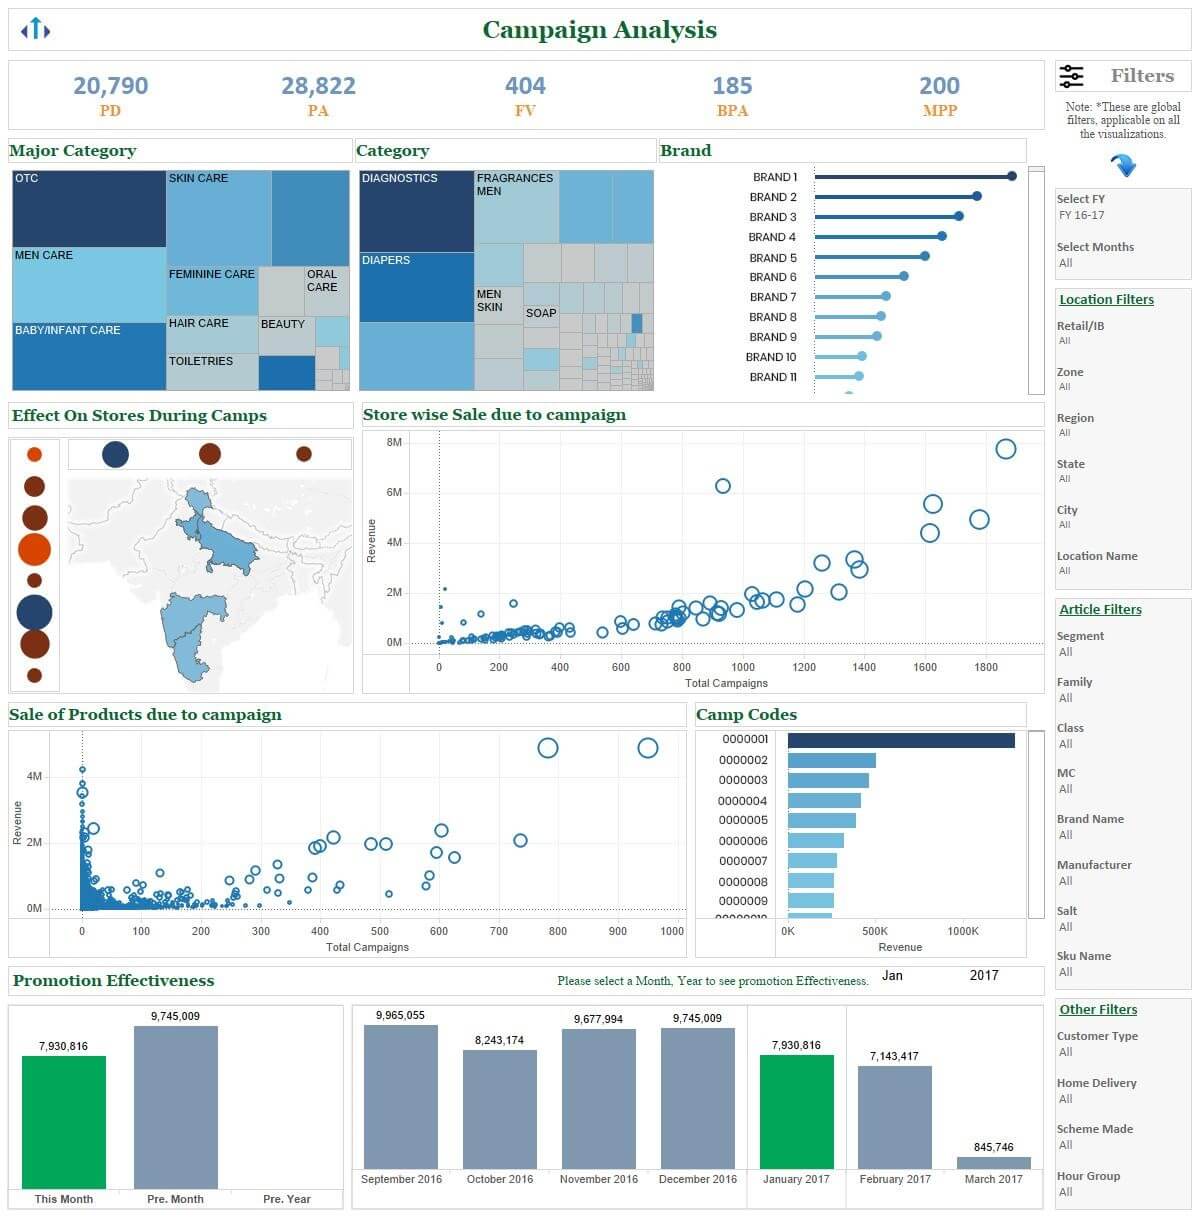
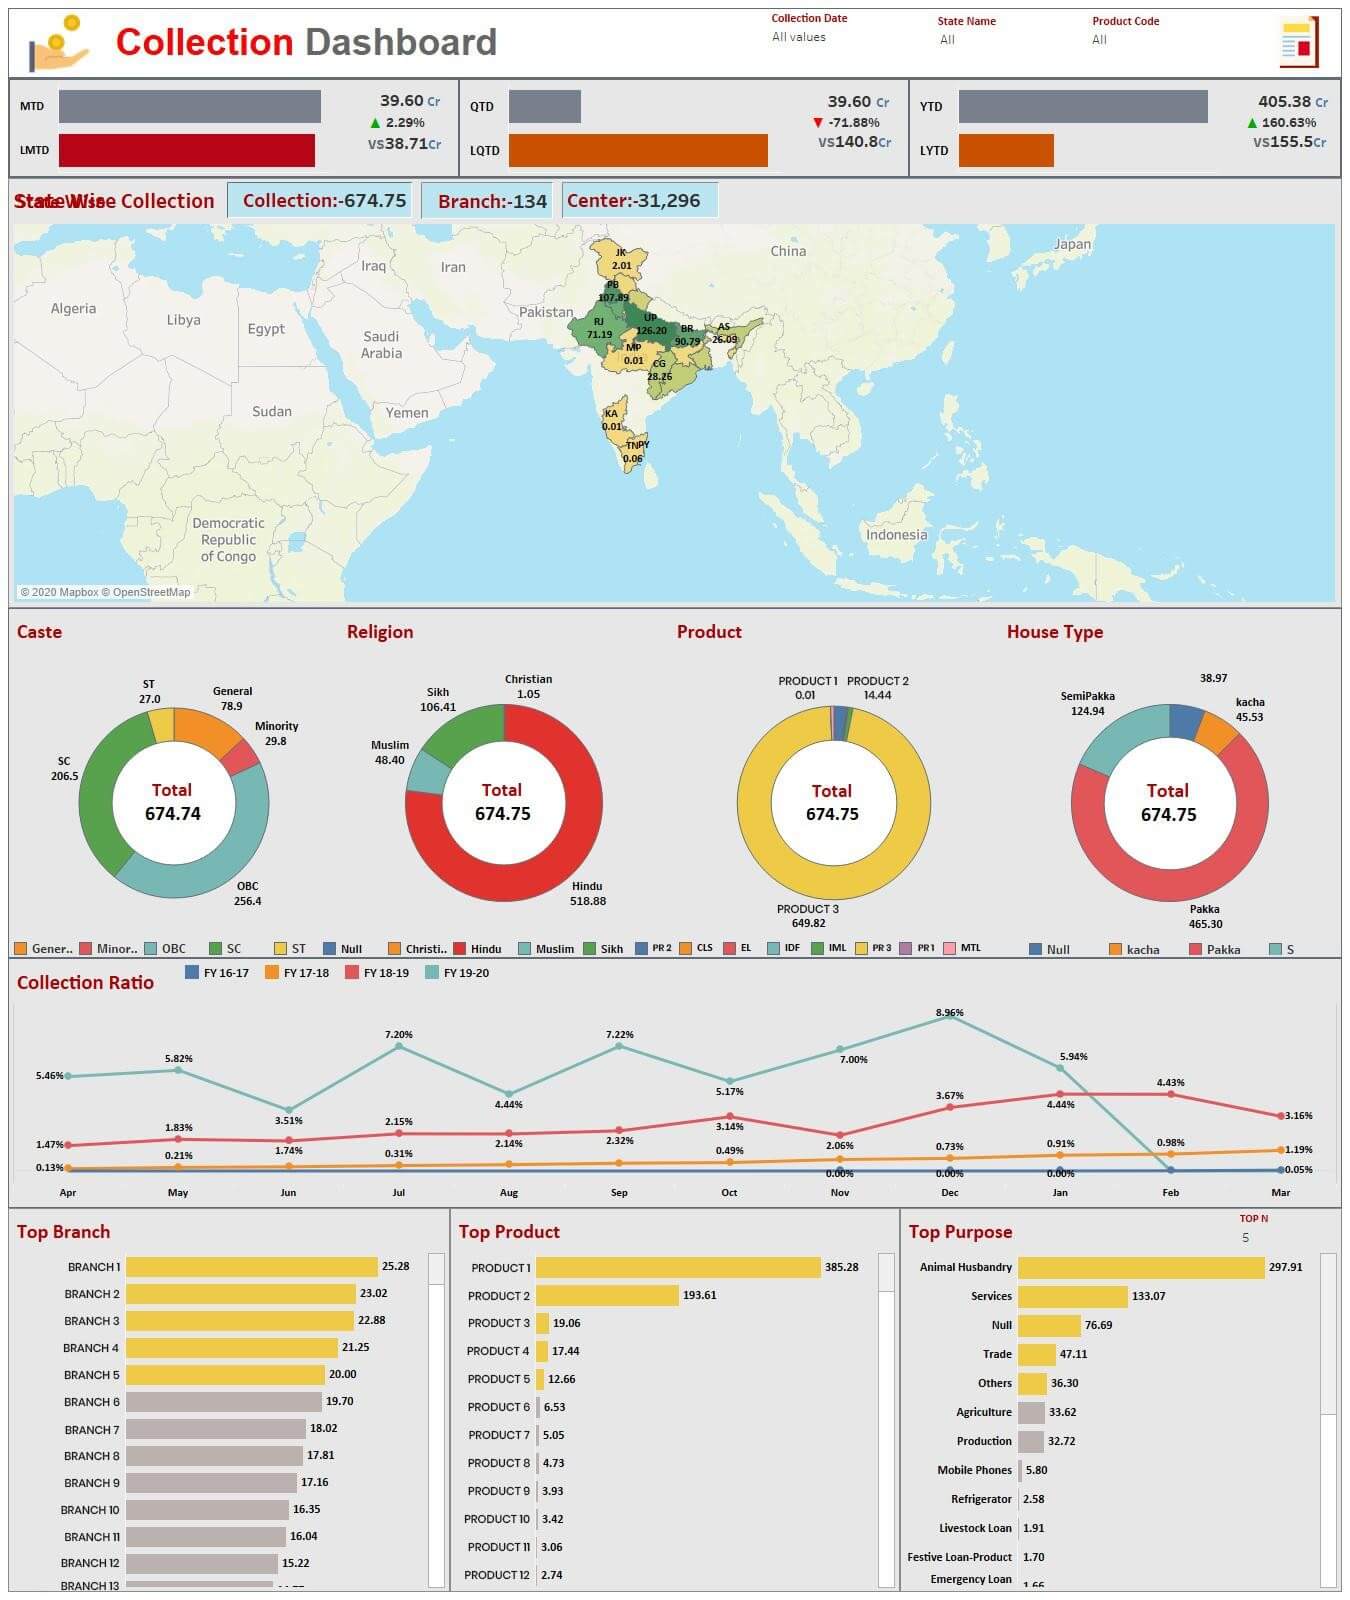
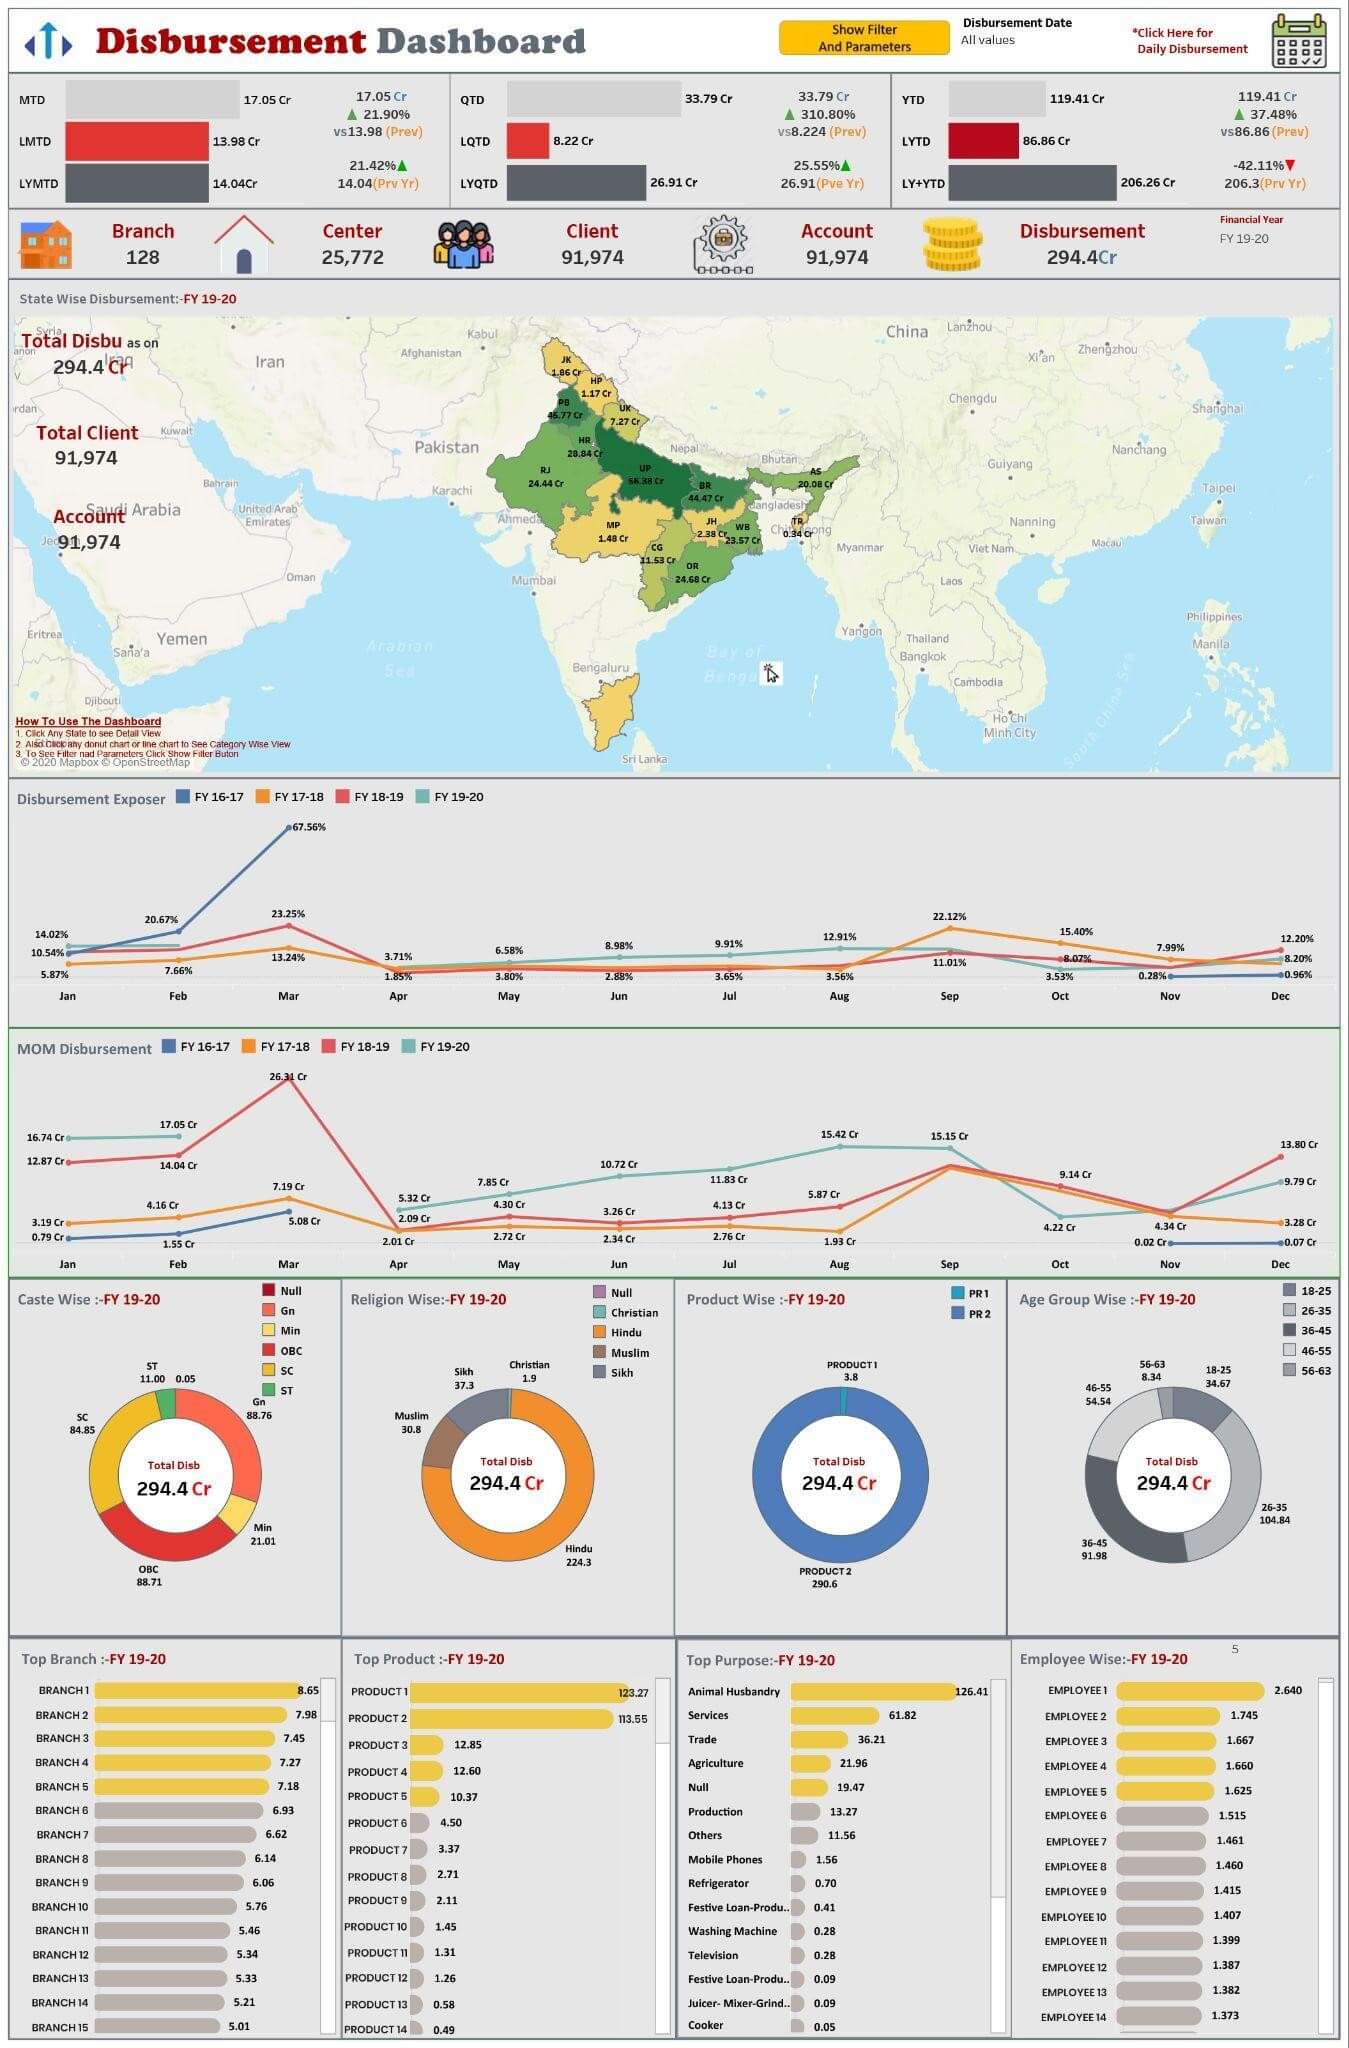
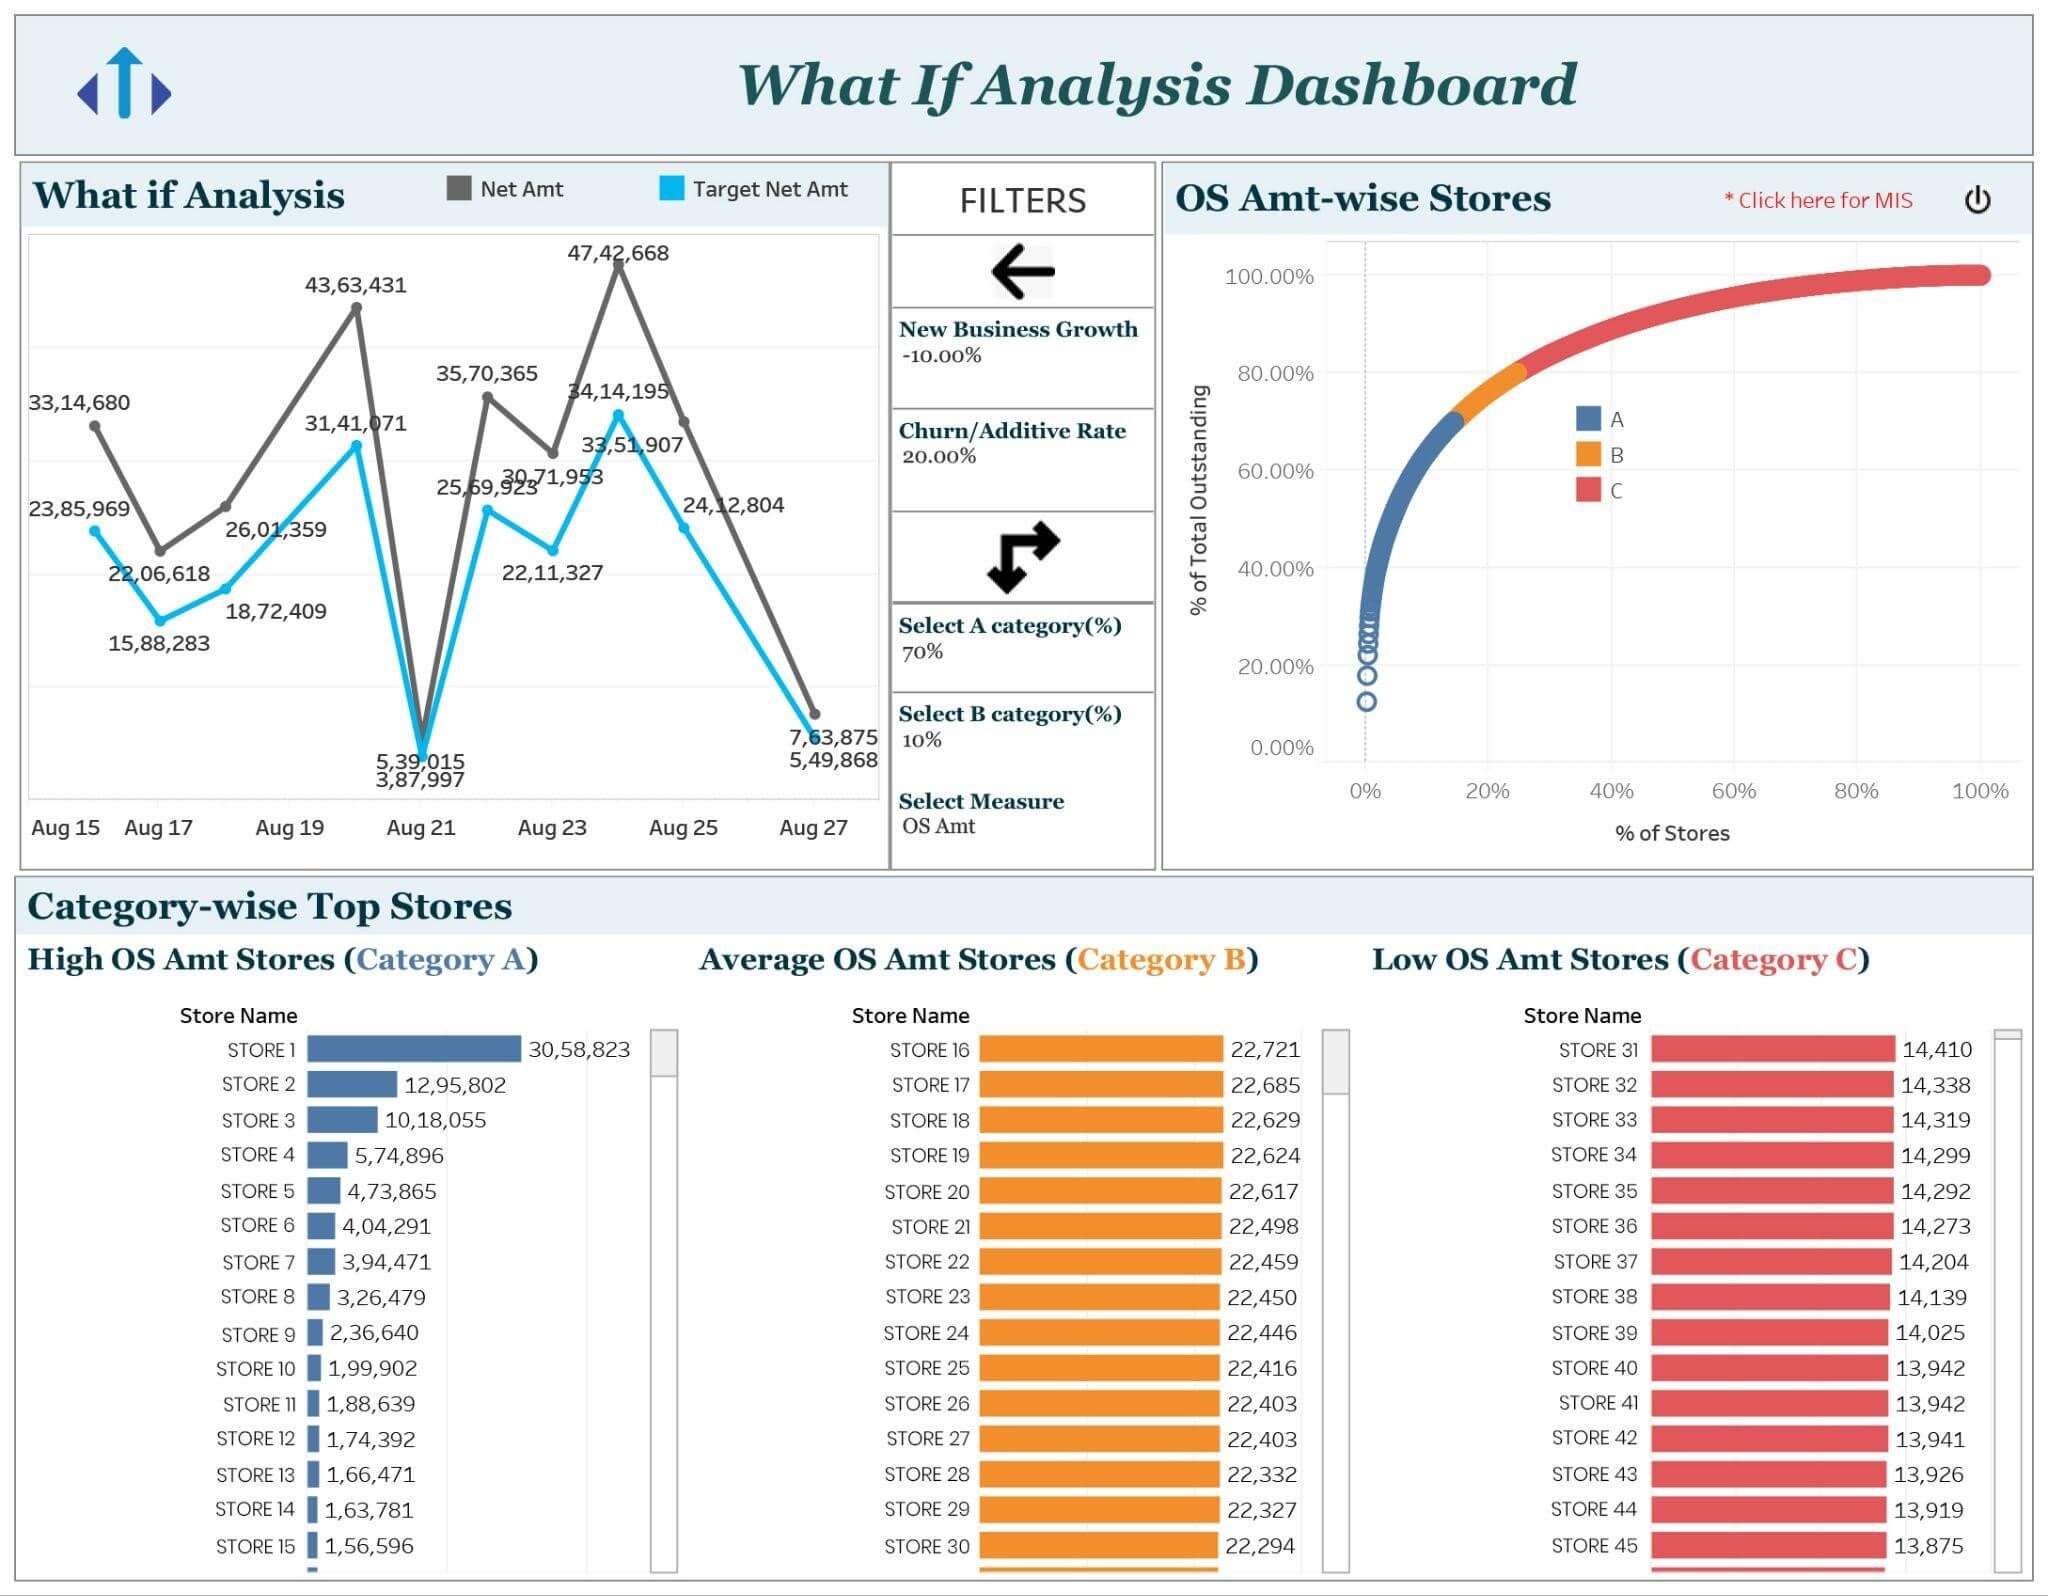
Tableau dashboards and Tableau reporting examples
Here are some of the Tableau dashboards created by the Uneecops Business Solutions team.
Sure, you’re motivated to create your own business report using Tableau.
Now, real learning, real quick!
Tableau Business Report Creation: A Guide
Here’s how to manage critical business reports in Tableau:
Step 1: Creating a Tableau Worksheet
Acquaint yourself with the Tableau worksheet and its functions. A Tableau worksheet contains all the tools and features needed for complete report creation.
A few elements in a Tableau sheet are mentioned here –
Data Pane: It shows the available fields from Tableau-connected data sources.
Dimensions Section: It is possible to access all the dimension type fields from this section. E.g., Order ID, Date, Region, Category, City, Sub-category, etc
Measures Section: It contains measure type fields (e.g. Quantity, Loss, Profit, Sales, etc.)
Columns and Rows: Drag and drop dimensions or measure fields using these to create charts.
Drag and Drop Area: The area in the sheet’s center where the visual or chart is created.
Filters: In this section, one can apply filters as per the analysis.
Pages: Section designed to place different fields and generate a preview.
Data Sources: Handle data at the data source, add new data sources, edit past ones, create joins, etc.
Sheet: Visit the active sheet and perform naming.
Step 2: Add Dimensions and Measures
Create visualizations by dragging and dropping rows or columns as per business requirements.
Step 3: Data Visualization
Create different visualizations suited as per your business. Learn to create visualizations using tutorials or training by a partner team.
Step 4: Making a Dashboard
Data can be represented best by creating dashboards in Tableau. We showcased examples of dashboards above. These help understand data and its story through tables, maps, charts, graphs, and other visual elements.
Select the dashboard tab to create a dashboard. Add visuals by dragging and dropping them from in the Sheets section.
Step 5: Sharing Dashboard as Report
A dashboard can be shared as a report with other users.
Tips for managing critical business reports in Tableau:
To get the desired results with a Tableau business reports, here are a few best practices to keep in mind:
- Plan before creating a report. Understand the objectives, audience and output.
- The report should be easy to understand – no clutter is the best way.
- Data visualizations must be interactive, understandable, and attractive.
- The report must be able to adapt to the latest technology.
Need more help? Looking for a Tableau license?
Uneecops Business Solutions (UBS) – Your Tableau Gold Partner
Uneecops is an esteemed Tableau Gold Partner, delivering unrivalled BI service, including reporting in Tableau. Our team of Tableau professionals will steer your business towards success by leveraging the software’s advanced analytical tools. As data analytics and business intelligence experts, we will help you make interactive Tableau business dashboards and gain powerful insights to optimize your business operations.
From Tableau license to BI service and reporting in Tableau support, we offer end-to-end solutions. Empower your enterprise to create meaningful business reports using Tableau. Reach out to us now to automate Tableau reports!